


Fig. 8.
Download original image
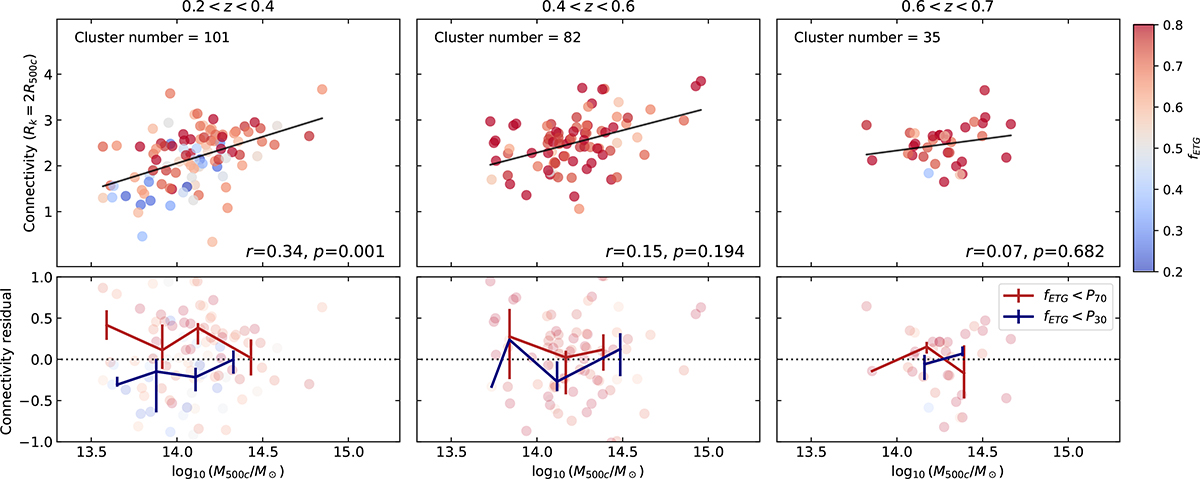
Mass–connectivity relation from Q1 data by considering clusters in three different redshift bins: 0.2 < z < 0.4 (left panel), 0.4 < z < 0.6 (middle panel), and 0.6 < z < 0.7 (right panel). The points are colour-coded by fETG fraction of early-type galaxies inside clusters (R < 2R500c). The black solid lines show the connectivity–mass relation on average, with the connectivities measured at R = 2R500c. In the bottom panel we show the connectivity residual, defined as κ − ⟨κ(M500)⟩ to remove mass dependence. The red (and blue) solid lines represent the average profile for clusters with fETG lower than (higher than) the 30th(70th) percentile. The partial Pearson correlation between cluster connectivity and ETG fraction, beyond first-order mass dependence, is given at the bottom of the panels, with the correlation coefficient (r) and the p-value.
Current usage metrics show cumulative count of Article Views (full-text article views including HTML views, PDF and ePub downloads, according to the available data) and Abstracts Views on Vision4Press platform.
Data correspond to usage on the plateform after 2015. The current usage metrics is available 48-96 hours after online publication and is updated daily on week days.
Initial download of the metrics may take a while.