


Fig. 5.
Download original image
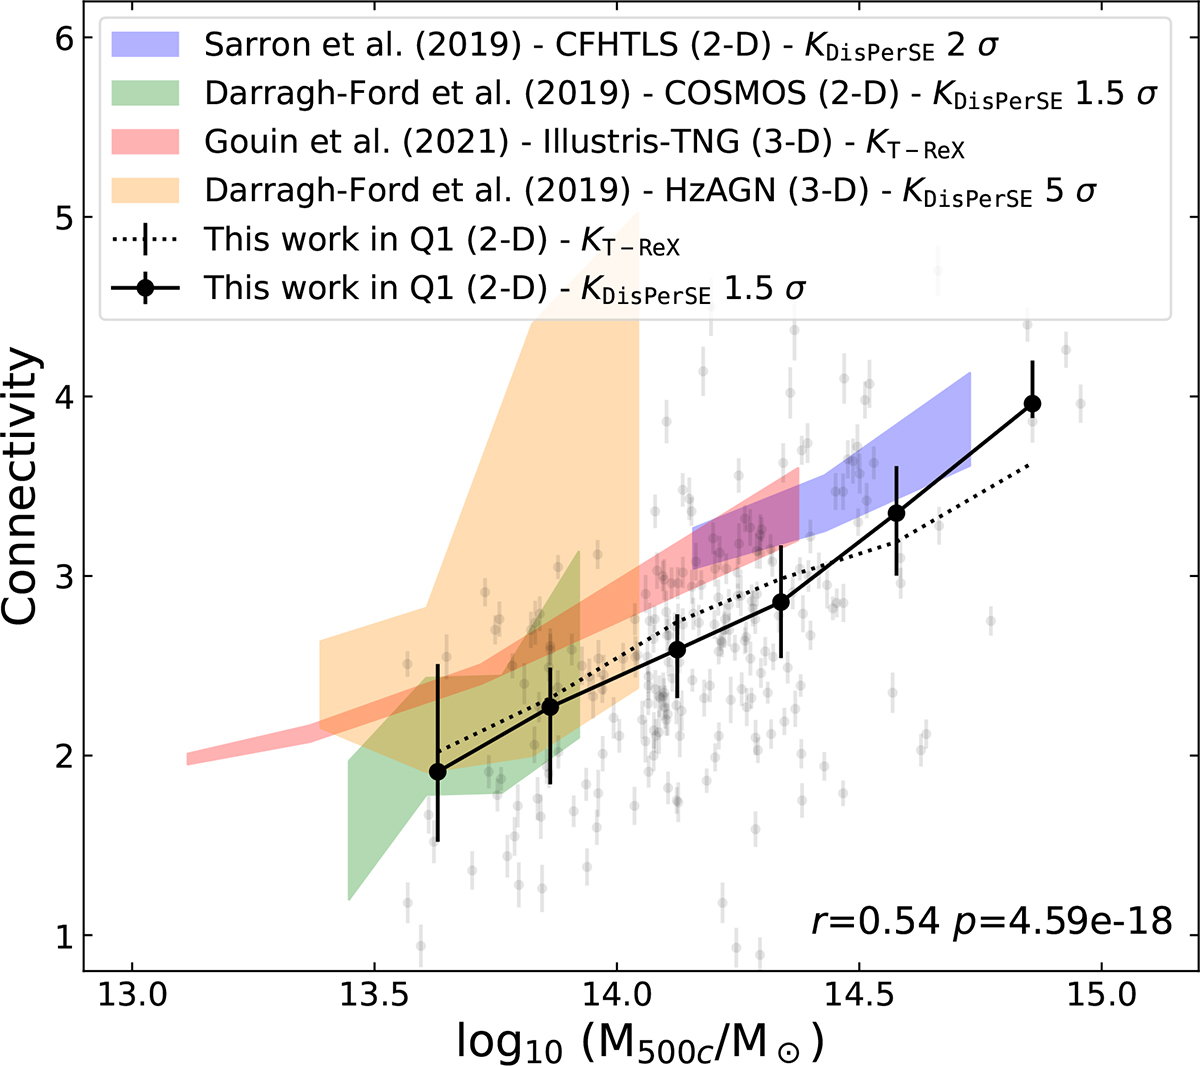
Median mass–connectivity relation measured in Q1 at 0.2 < z < 0.7 (in black) compared with results obtained, from the Horizon-AGN simulation (in pink; Darragh Ford et al. 2019) and the IllustrisTNG (in red; Gouin et al. 2021), and with observational results, from CFHTLS (Sarron et al. 2019) and COSMOS (Darragh Ford et al. 2019). The sigma values in the legend refer to the persistence threshold applied with the DisPerSE algorithm. The Pearson correlation between cluster connectivity and its mass is given at the bottom of the panel, with the correlation coefficient (r) and the p-value.
Current usage metrics show cumulative count of Article Views (full-text article views including HTML views, PDF and ePub downloads, according to the available data) and Abstracts Views on Vision4Press platform.
Data correspond to usage on the plateform after 2015. The current usage metrics is available 48-96 hours after online publication and is updated daily on week days.
Initial download of the metrics may take a while.