


Fig. 8.
Download original image
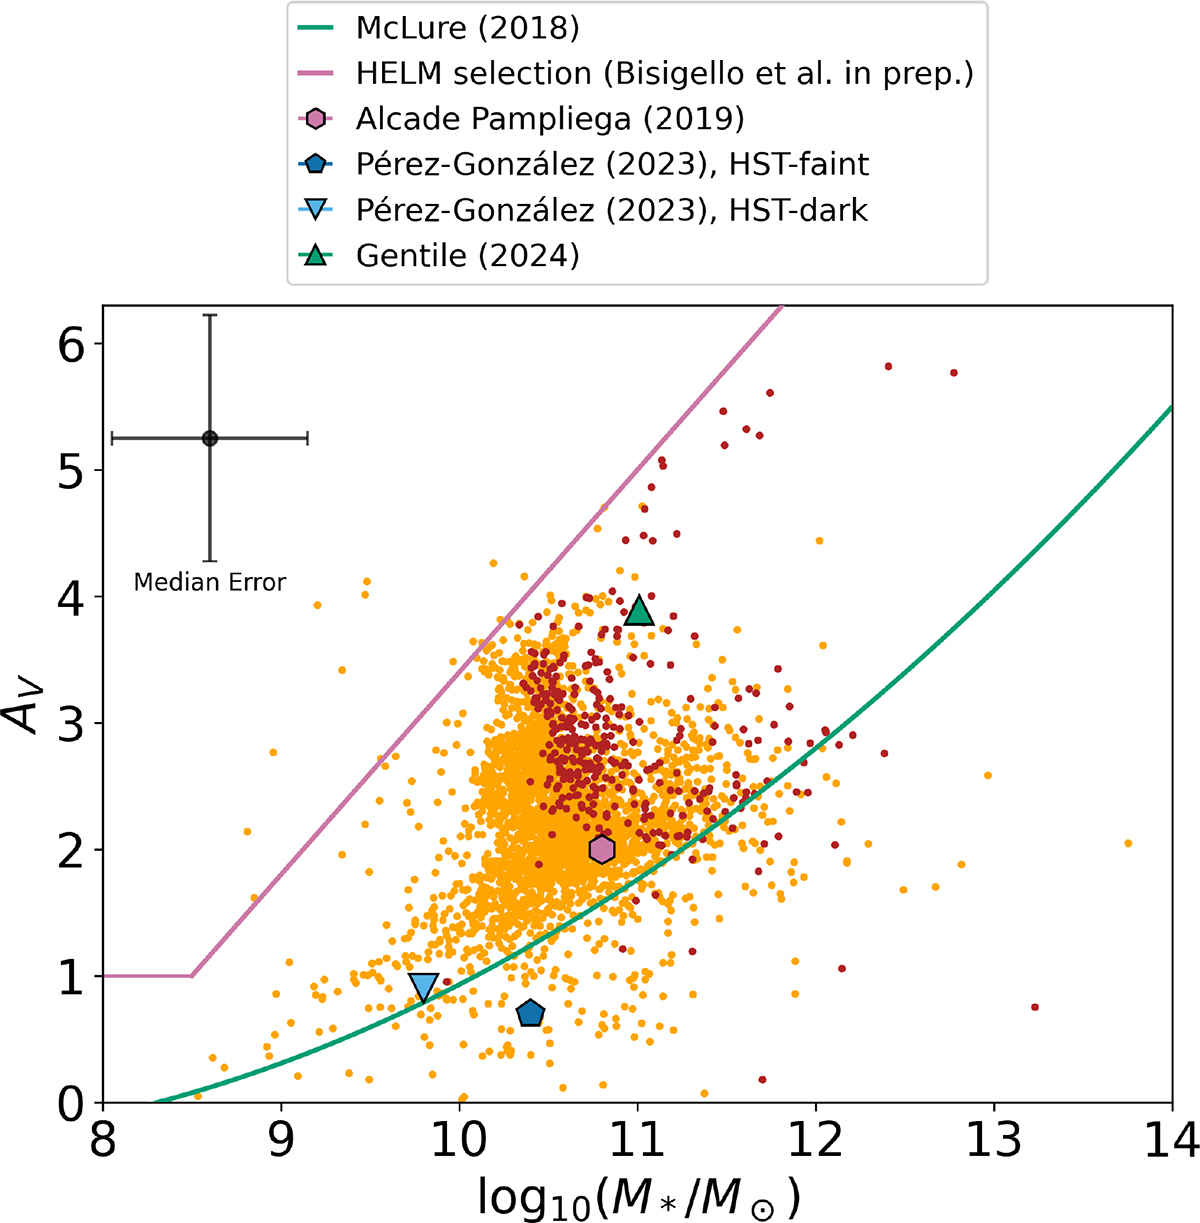
Dust attenuation versus stellar mass of the HIERO sample. The x-axis is on a logarithmic scale. The solid dark teal line reports the relation from McLure et al. (2018), while the purple line delimits the area that identifies the so-called Highly Extincted Low-Mass (HELM) galaxies (Bisigello et al. 2025). The median error for both quantities is reported in the top-left corner of the plot. Different symbols report values from previous studies, as indicated in the legend.
Current usage metrics show cumulative count of Article Views (full-text article views including HTML views, PDF and ePub downloads, according to the available data) and Abstracts Views on Vision4Press platform.
Data correspond to usage on the plateform after 2015. The current usage metrics is available 48-96 hours after online publication and is updated daily on week days.
Initial download of the metrics may take a while.