


Fig. 16.
Download original image
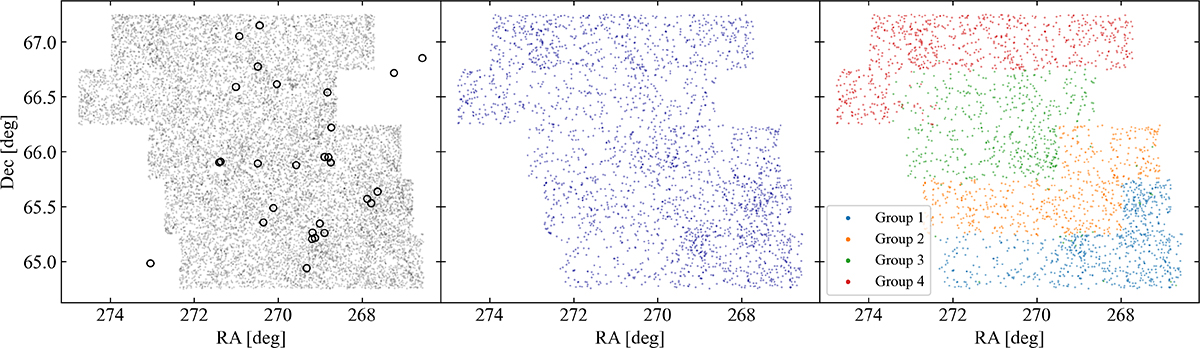
Left: Spatial distribution of all candidates in the 25 tiles. The open black circles correspond to the positions of galaxies within a distance of about 200 Mpc from the HECATE sample. It can be seen that several of these positions have corresponding overdensities in the distribution of the automatically selected dwarf candidates as well. Middle: Spatial distribution of the final dwarf candidates where it can be seen that some of the overdensities around the massive galaxies shown in the left plot remain present in the final dwarf sample. Right: Spatial distribution of the final dwarf candidates, colour-coded by group. There are no large discontinuities in the number of dwarf candidates near the boundaries between groups.
Current usage metrics show cumulative count of Article Views (full-text article views including HTML views, PDF and ePub downloads, according to the available data) and Abstracts Views on Vision4Press platform.
Data correspond to usage on the plateform after 2015. The current usage metrics is available 48-96 hours after online publication and is updated daily on week days.
Initial download of the metrics may take a while.