


Open Access
Fig. 5.
Download original image
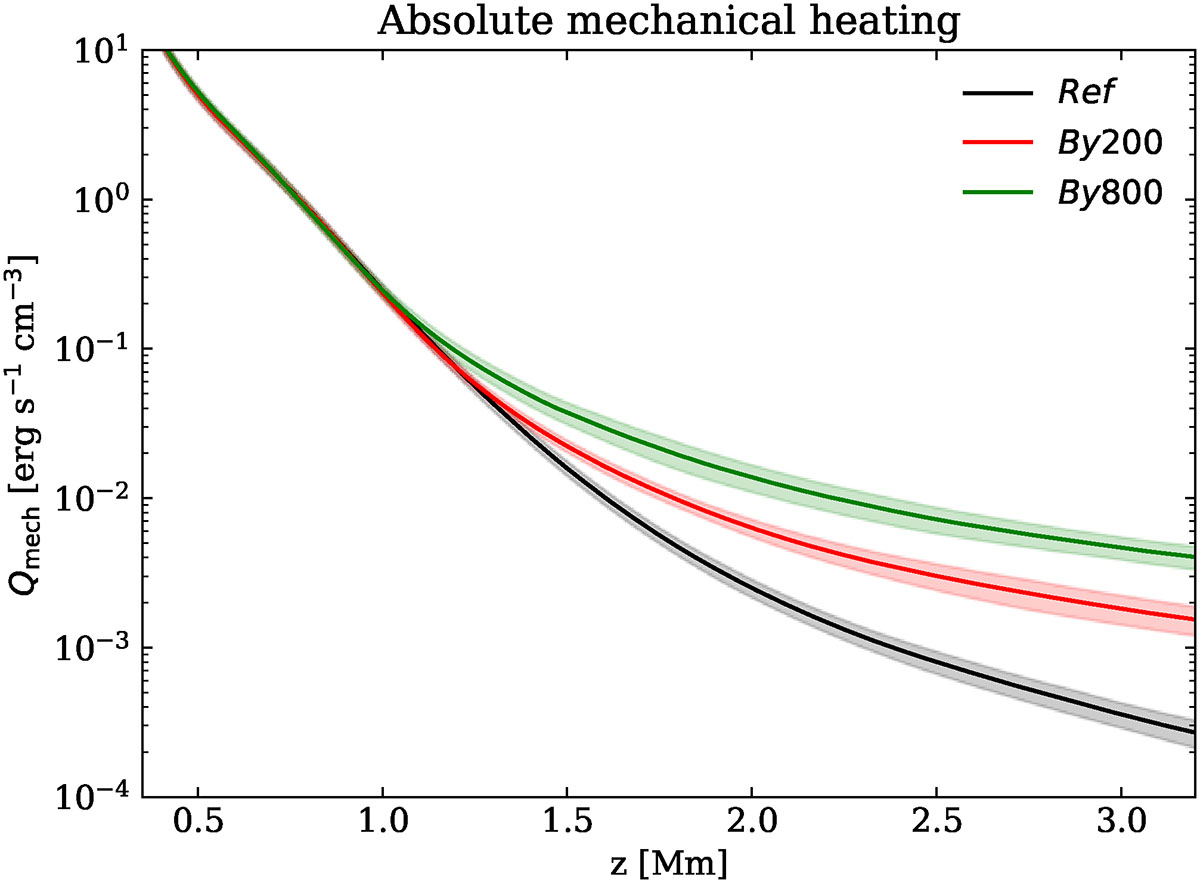
Comparison of the mechanical heating profiles Qmech = Qν + Qη + Qcomp as a function of height, among Ref, By200, and By800 in black, red, and green, respectively, averaged horizontally in space and over one solar hour in time. The envelope indicates ±1 standard deviation in time during the solar-hour average.
Current usage metrics show cumulative count of Article Views (full-text article views including HTML views, PDF and ePub downloads, according to the available data) and Abstracts Views on Vision4Press platform.
Data correspond to usage on the plateform after 2015. The current usage metrics is available 48-96 hours after online publication and is updated daily on week days.
Initial download of the metrics may take a while.