


Fig. 3.
Download original image
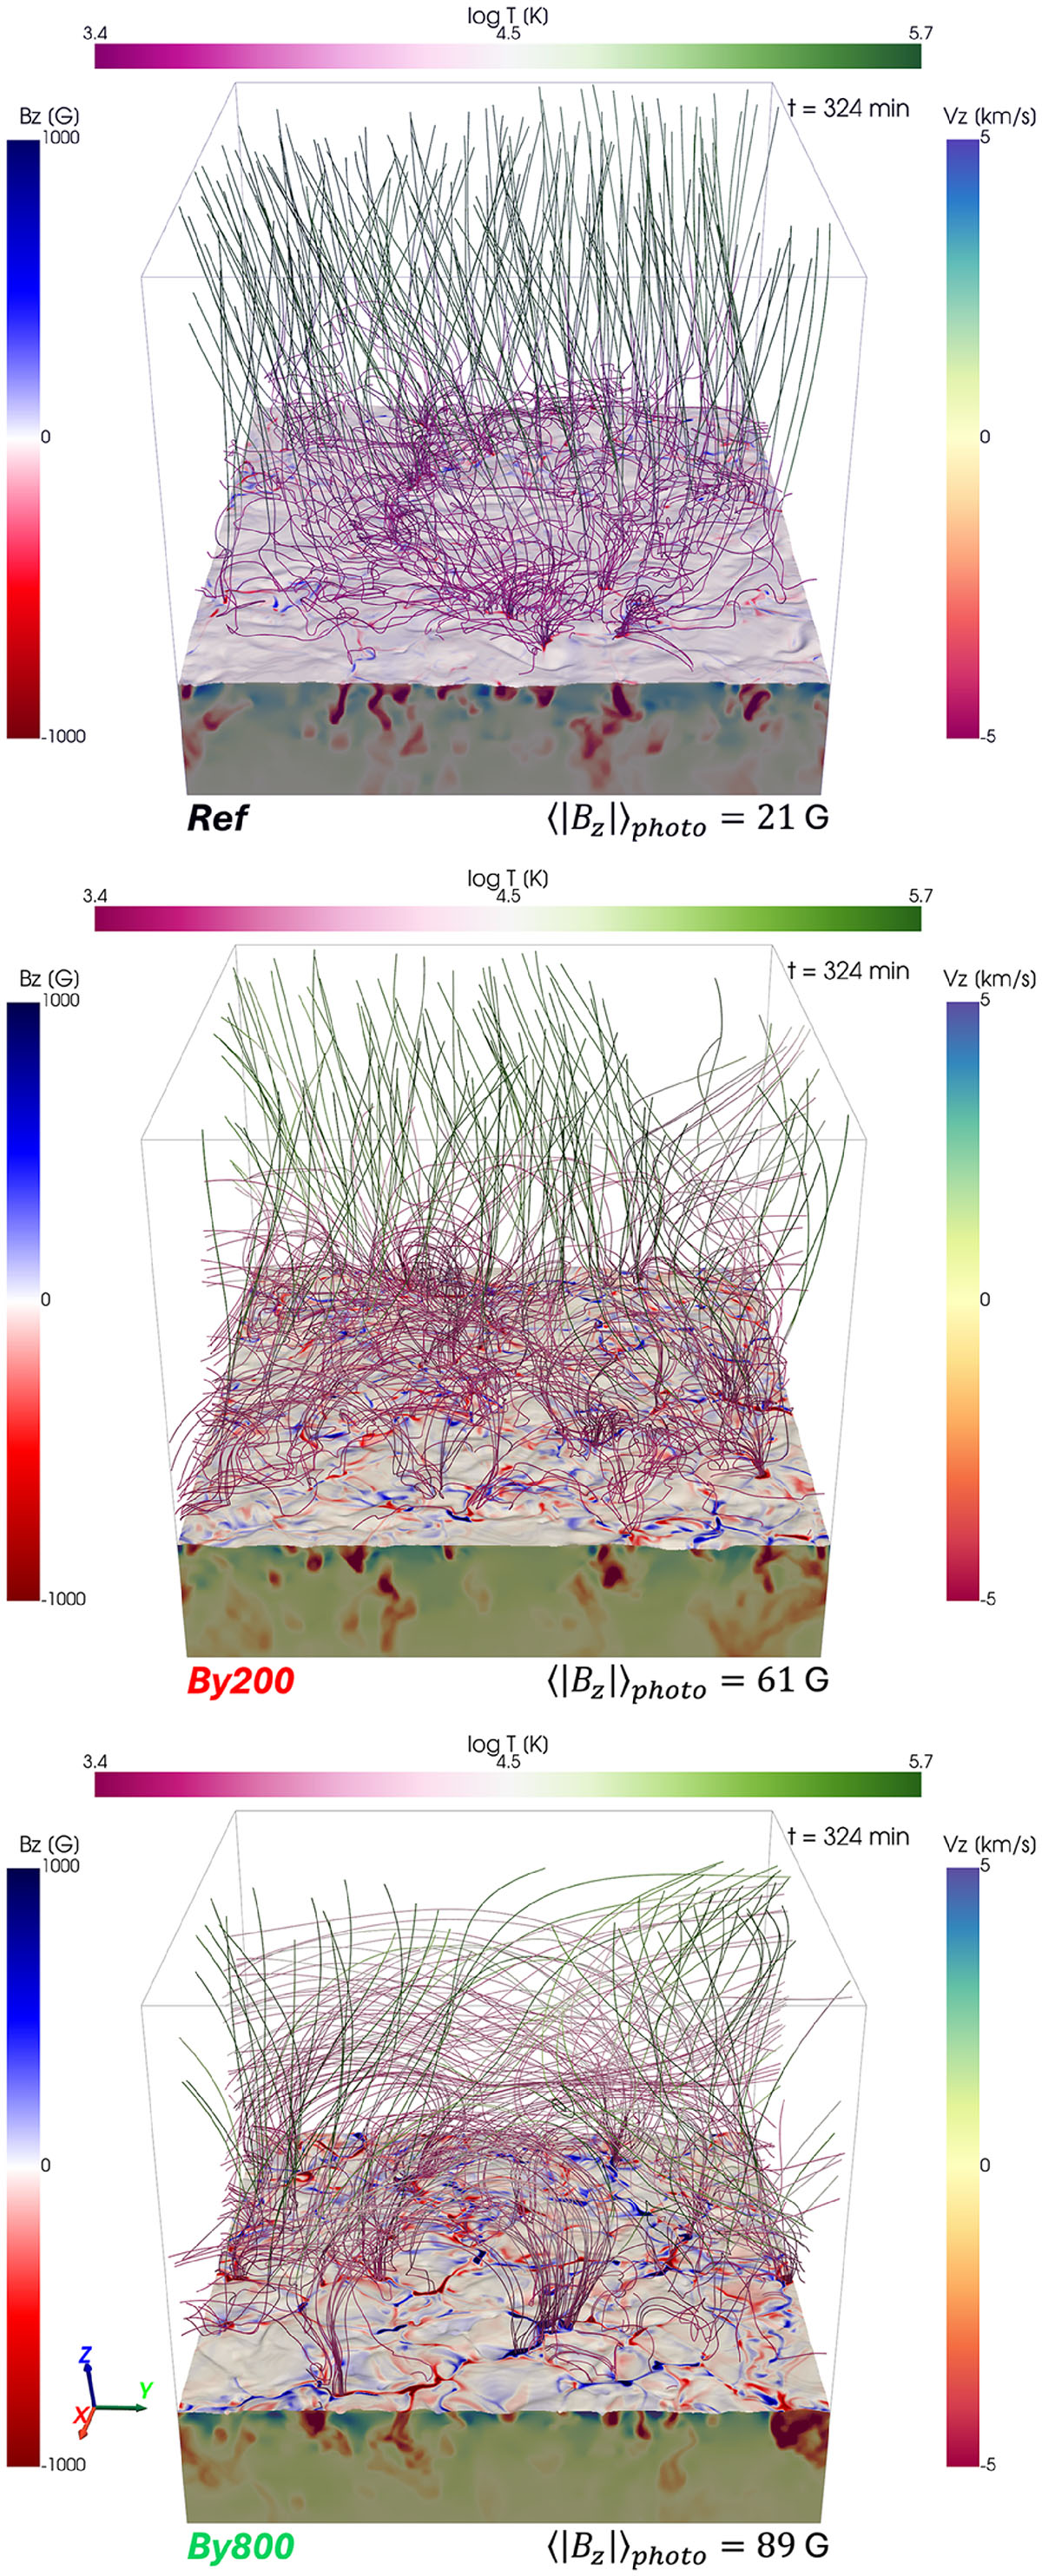
3D visualisations of magnetic and thermodynamic structures in the three simulations: Ref (top), By200 (middle), and By800 (bottom), shown during their quasi-static phases at t = 324 min. The corrugated horizontal surface marks the τ500 = 1 layer, coloured by the vertical magnetic field Bz. The vertical side panels show the convective velocity vz in the upper convection zone, while magnetic field lines, seeded from a uniform 15 × 15 grid at z = 3 Mm, are coloured by temperature. This transitions from pink in the chromospheric temperature minimum (∼4000 K), to white in the TR (∼40 000 K), and green in the low corona (∼500 000 K). The panels illustrate the progressive emergence of horizontal flux, from the nearly vertical, coronal-hole-like topology of Ref, through loop-dominated By200, to the strongly inclined, horizontally dominated configuration of By800. Associated movies are available online.
Current usage metrics show cumulative count of Article Views (full-text article views including HTML views, PDF and ePub downloads, according to the available data) and Abstracts Views on Vision4Press platform.
Data correspond to usage on the plateform after 2015. The current usage metrics is available 48-96 hours after online publication and is updated daily on week days.
Initial download of the metrics may take a while.