


Fig. 11.
Download original image
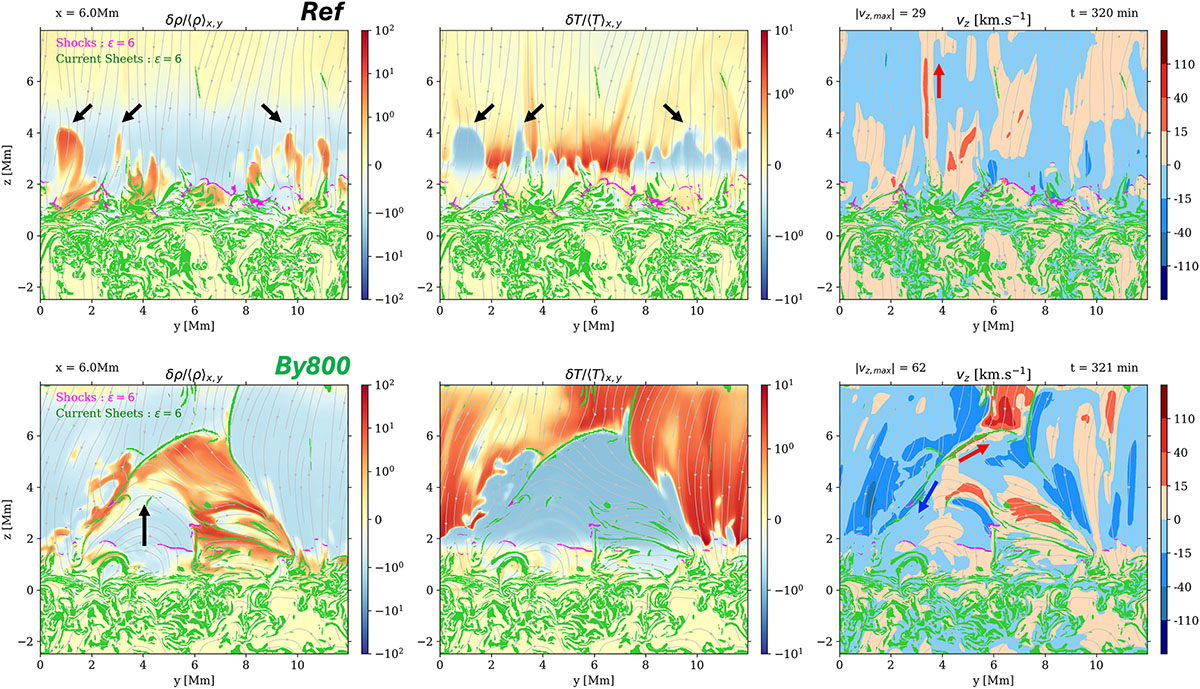
Mass-loading behavior of Ref (top row) and By800 (bottom row). We highlight the position of shocks and CSs for all panels, following Eqs. (2) and (1), respectively. Left: Density variation, δρ/⟨ρ⟩x, y, taken at x = 6 Mm for each given time step and of each given simulation. This illustrates material more (red) or less (blue) dense than the surrounding material at that height. Middle: Same but for the temperature variation, δT/⟨T⟩x, y. Right: Same but for the vertical velocity component, vz, where red (blue, respectively) shows upwards (downwards, respectively) motions. Please note for the top row that dark arrows indicate over-densities, corresponding here to cooler material entering the coronal medium, and corresponding to shock-mediated (purple contours) type-I spicule dynamics (see also the red arrow indicating an upwards spicular motion and also see Fig. 4 of Paper I). We also note that for the bottom row, the dark arrow highlights the motion of the emerging magnetic loop-like structure, transporting the over-density (red) up to coronal heights. Interactions with the overlying magnetic field create thin reconnecting CS structure (green contours), where bipolar flows are highlighted by red and blue arrows (see also Fig. 5 of Paper I). Associated movies are available online.
Current usage metrics show cumulative count of Article Views (full-text article views including HTML views, PDF and ePub downloads, according to the available data) and Abstracts Views on Vision4Press platform.
Data correspond to usage on the plateform after 2015. The current usage metrics is available 48-96 hours after online publication and is updated daily on week days.
Initial download of the metrics may take a while.