


Fig. 10.
Download original image
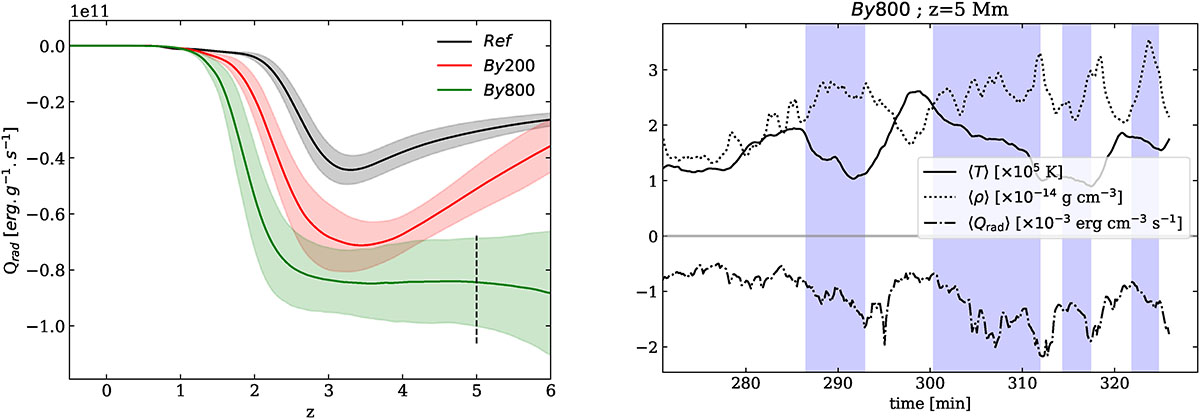
Left: Comparison of radiative cooling profiles. The layout is similar to Fig. 9. Right: Temporal evolution of temperature T (solid), density ρ (dotted) and radiative cooling Q (dotted-dashed) values, averaged over the horizontal extent at z = 5 Mm. Blue-shaded time ranges highlight periods when the temperature decreases substantially, in order to compare with radiative cooling and density enhancements.
Current usage metrics show cumulative count of Article Views (full-text article views including HTML views, PDF and ePub downloads, according to the available data) and Abstracts Views on Vision4Press platform.
Data correspond to usage on the plateform after 2015. The current usage metrics is available 48-96 hours after online publication and is updated daily on week days.
Initial download of the metrics may take a while.