


Fig. 1.
Download original image
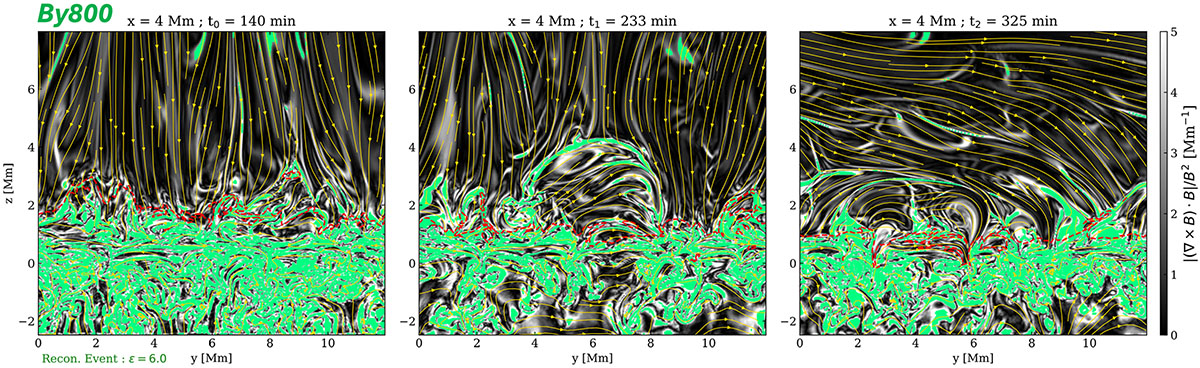
Magnetic-field evolution during the three main phases of the By800 experiment for t0 = 140 min, t1 = 233 min and t2 = 325 min. The panels show the normalised parallel current, |∇×B ⋅ B|/|B|2 (grayscale), and the reconnecting current sheets (CSs; green), identified using the criterion of Eq. (1). Magnetic-field lines are shown with yellow streamlines, and the β = 1 surface is drawn with a dashed red line. We note how the height of the latter has moved from the initial t0 to the quasi-static timestep t2, due to the injection of emerging magnetic-loop structures, increasing the volume filled by a subsequently reconnecting CS. The associated movie is available online.
Current usage metrics show cumulative count of Article Views (full-text article views including HTML views, PDF and ePub downloads, according to the available data) and Abstracts Views on Vision4Press platform.
Data correspond to usage on the plateform after 2015. The current usage metrics is available 48-96 hours after online publication and is updated daily on week days.
Initial download of the metrics may take a while.