


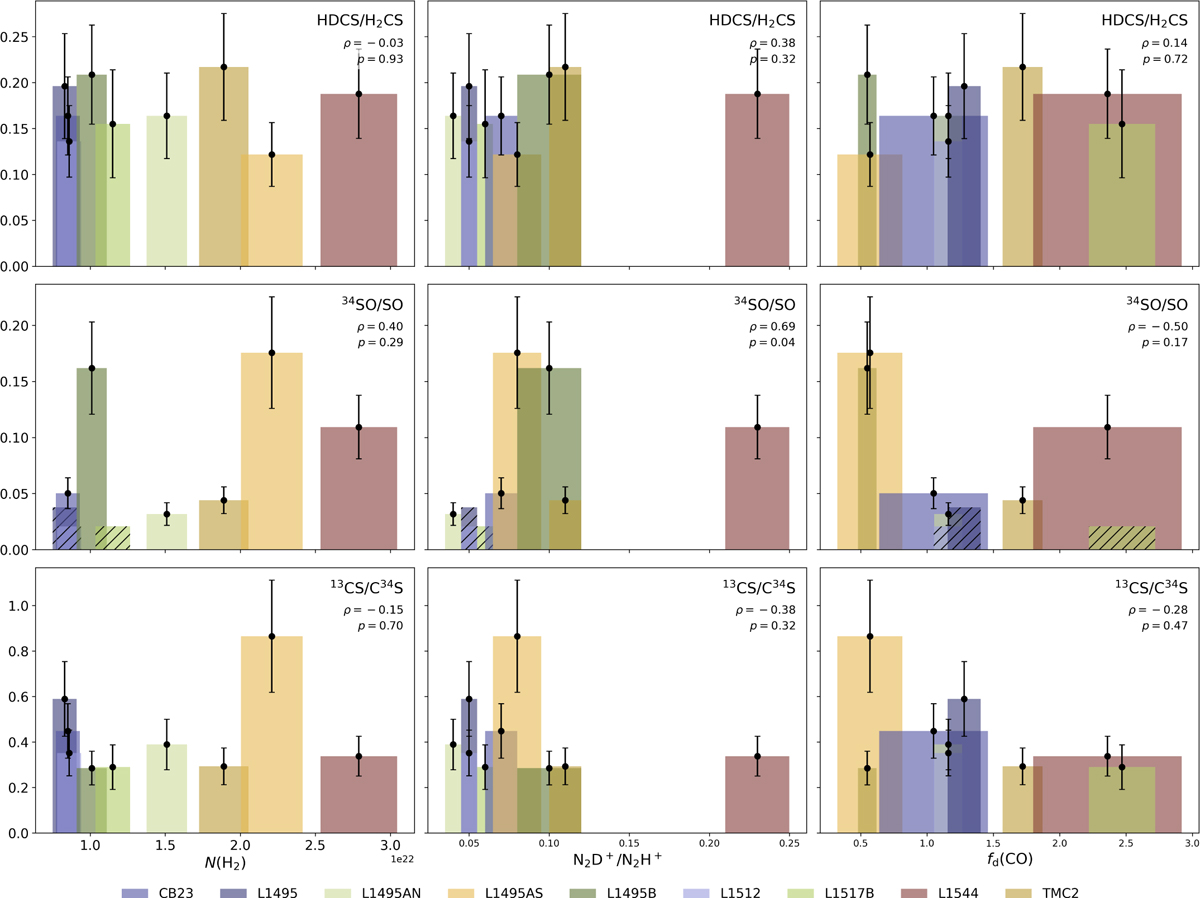
Fig. 5
Download original image
Molecular abundance ratios probing isotopic fractionation as a function of the three evolutionary tracers. For clarity, the width of each bar reflects half the uncertainty in the corresponding evolutionary tracer. Hatched bars indicate ratios where one of the two abundances represented an upper limit (non-detections). Each panel also shows the Spearman rank correlation coefficient (ρ) and the corresponding p-value.
Current usage metrics show cumulative count of Article Views (full-text article views including HTML views, PDF and ePub downloads, according to the available data) and Abstracts Views on Vision4Press platform.
Data correspond to usage on the plateform after 2015. The current usage metrics is available 48-96 hours after online publication and is updated daily on week days.
Initial download of the metrics may take a while.