


Fig. 1
Download original image
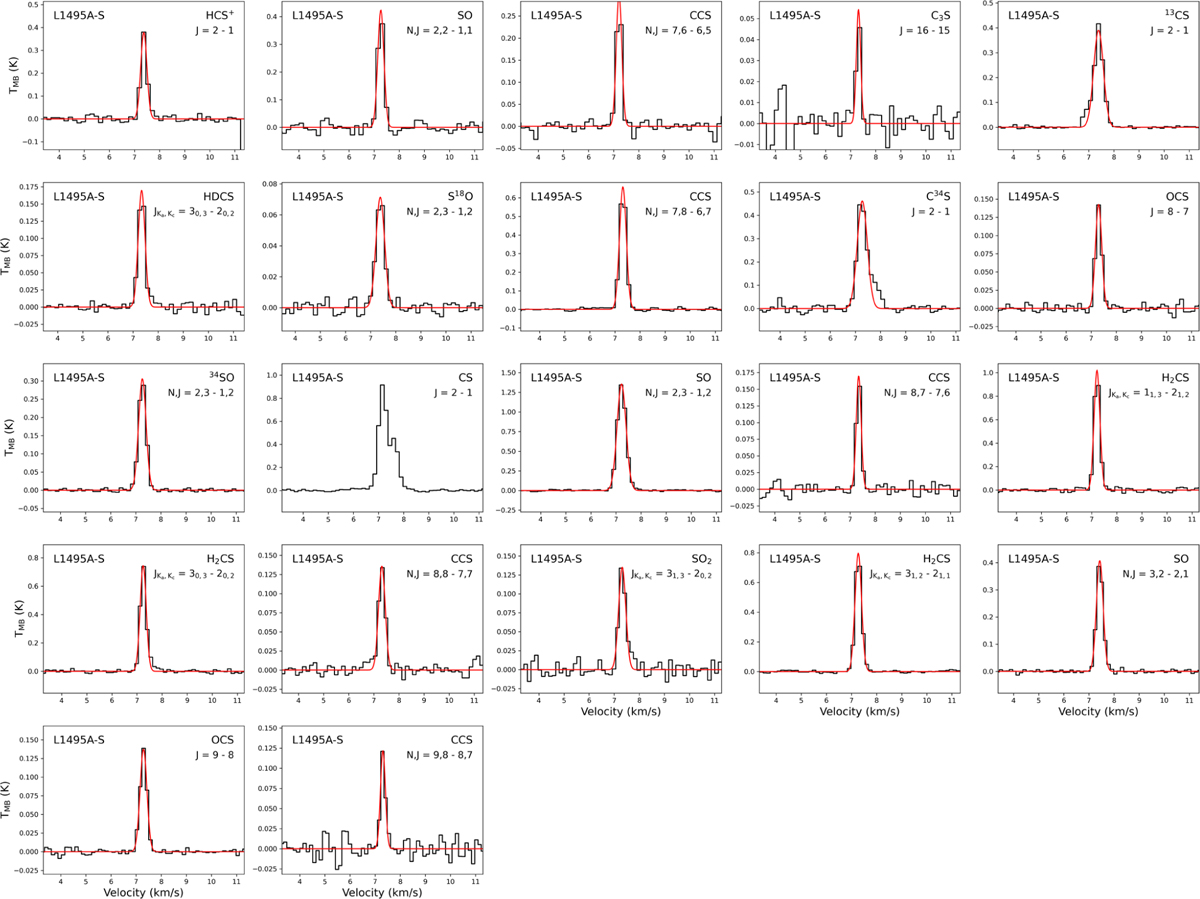
Spectra of molecules observed toward the dust peak of the starless core L1495A-S (in black). The red line indicates the best fit to a Gaussian line shape model. For each panel, the molecule is indicated on the top right, with the transition stated below. CS shows signs of self-absorption; hence, no Gaussian fit was performed.
Current usage metrics show cumulative count of Article Views (full-text article views including HTML views, PDF and ePub downloads, according to the available data) and Abstracts Views on Vision4Press platform.
Data correspond to usage on the plateform after 2015. The current usage metrics is available 48-96 hours after online publication and is updated daily on week days.
Initial download of the metrics may take a while.