


Fig. 9.
Download original image
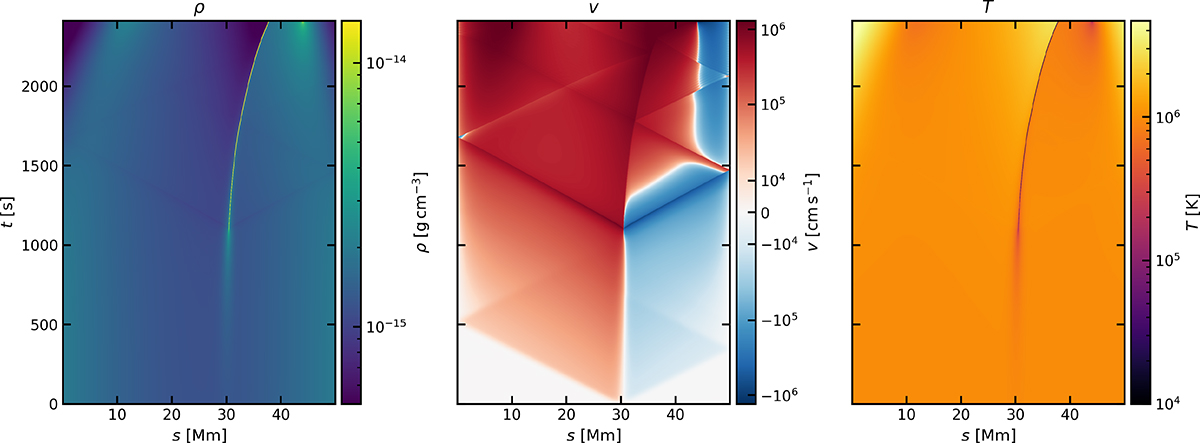
Space–time heatmaps of total density ρ (left), velocity v (centre), and temperature T (right) are shown for the non-linear MPI-AMRVAC evolution of the isobaric perturbation (σ = 1 Mm, s0 = 30 Mm). The condensation forms at s = 30 Mm and slides rightward after t ≃ 1200 s. Diagonal features in the velocity panel are sub-sonic evacuation waves propagating outward from the condensation site. Flanking regions of elevated temperature reflect heating of the mass-depleted footpoints under the fixed balanced-heating prescription.
Current usage metrics show cumulative count of Article Views (full-text article views including HTML views, PDF and ePub downloads, according to the available data) and Abstracts Views on Vision4Press platform.
Data correspond to usage on the plateform after 2015. The current usage metrics is available 48-96 hours after online publication and is updated daily on week days.
Initial download of the metrics may take a while.