


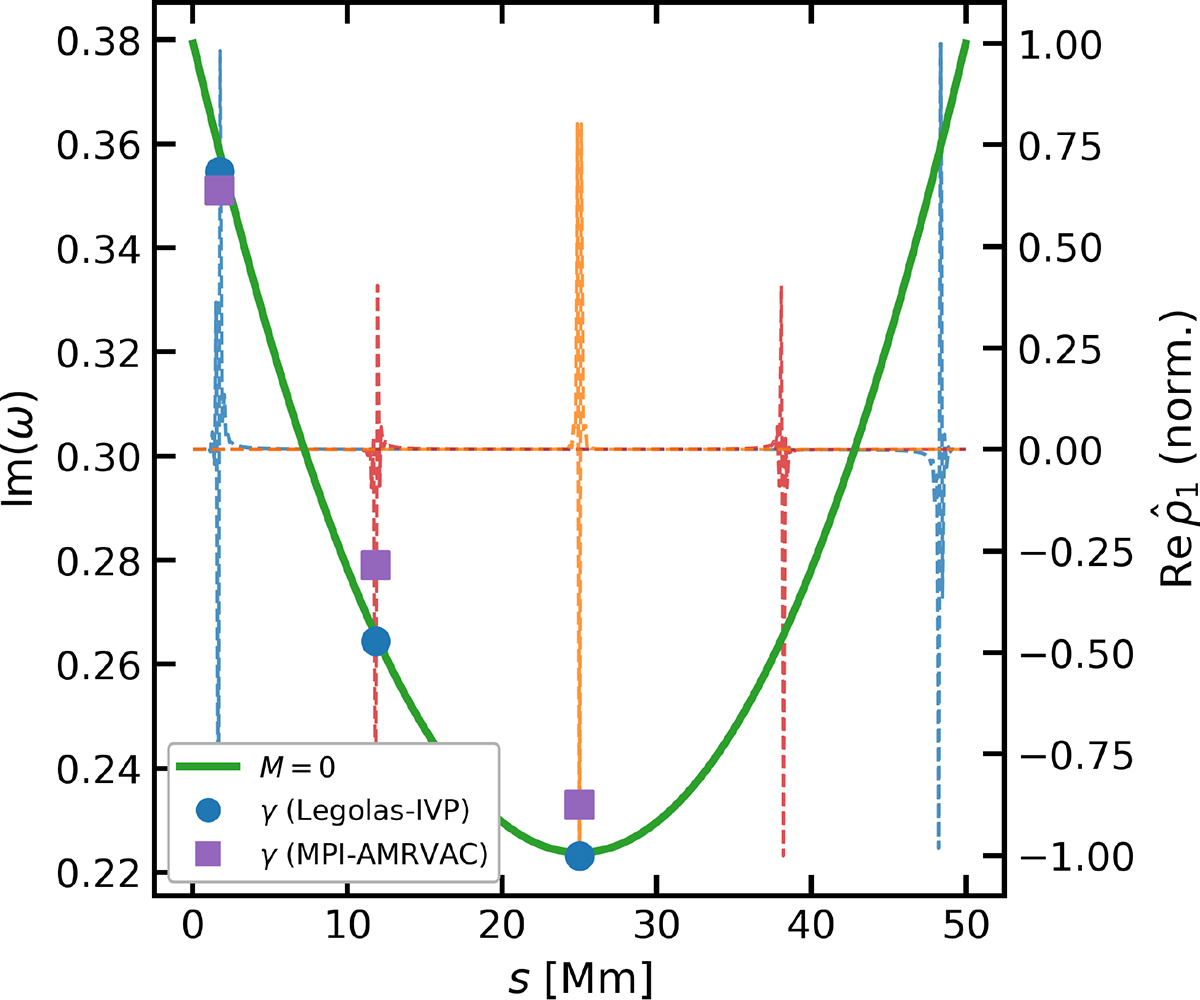
Fig. 7.
Download original image
Spatial selectivity of thermal-continuum modes. The green curve shows the thermal-continuum branch (M = 0) plotted as a function of loop coordinate s. Coloured dashed curves (right axis) show the real part of three representative thermal-continuum density eigenfunctions. Blue circles and purple squares mark growth rates γ measured using LEGOLAS-IVP and MPI-AMRVAC respectively.
Current usage metrics show cumulative count of Article Views (full-text article views including HTML views, PDF and ePub downloads, according to the available data) and Abstracts Views on Vision4Press platform.
Data correspond to usage on the plateform after 2015. The current usage metrics is available 48-96 hours after online publication and is updated daily on week days.
Initial download of the metrics may take a while.