


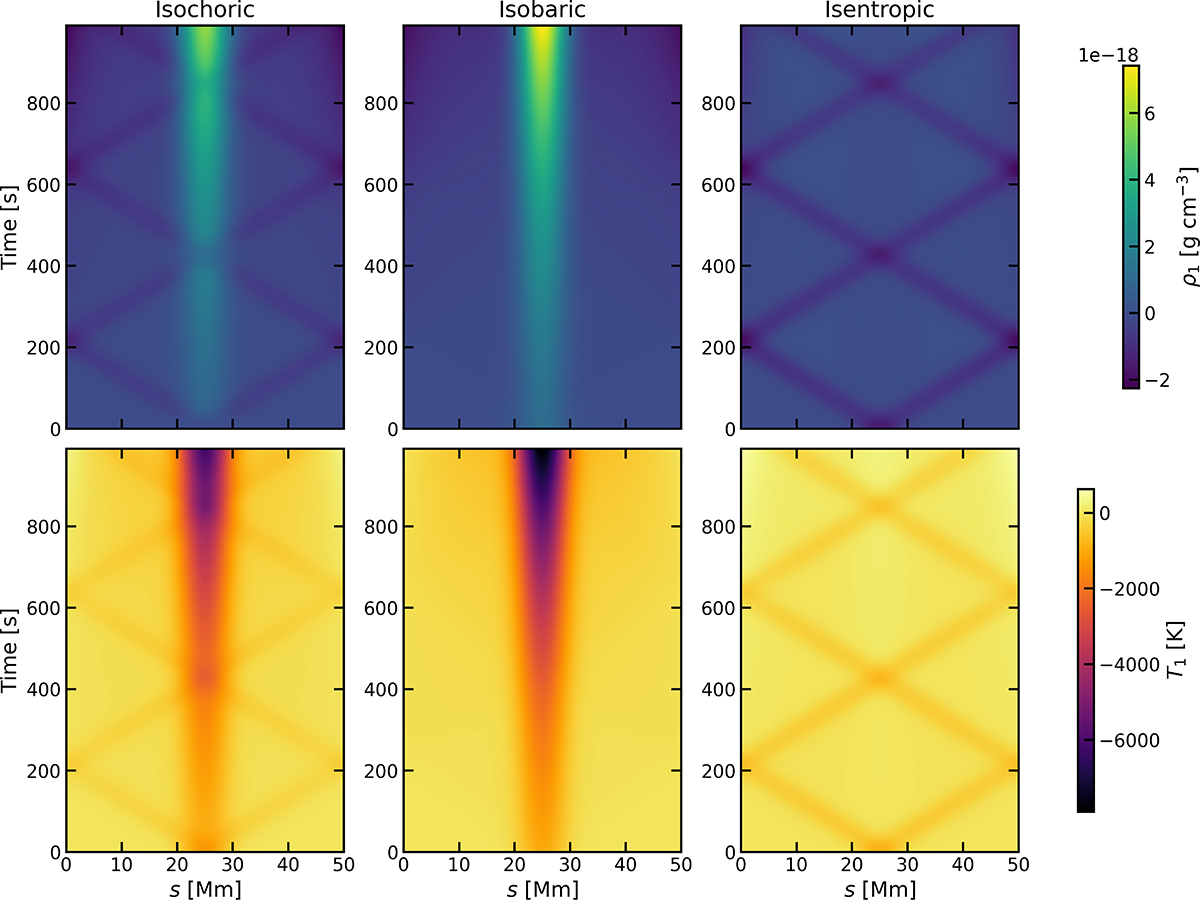
Fig. 2.
Download original image
Space–time maps of density (top row) and temperature (bottom row) perturbations for the three initial pulses: isochoric (left), isobaric (middle), and isentropic (right). Each panel shows the perturbation amplitude as a function of position along the loop and simulation time. Note how a centrally cooling, denser region at the apex develops for both isochoric and isobaric pulses, corresponding to the thermal instability, which is not triggered by an isentropic pulse.
Current usage metrics show cumulative count of Article Views (full-text article views including HTML views, PDF and ePub downloads, according to the available data) and Abstracts Views on Vision4Press platform.
Data correspond to usage on the plateform after 2015. The current usage metrics is available 48-96 hours after online publication and is updated daily on week days.
Initial download of the metrics may take a while.