


Fig. B.1.
Download original image
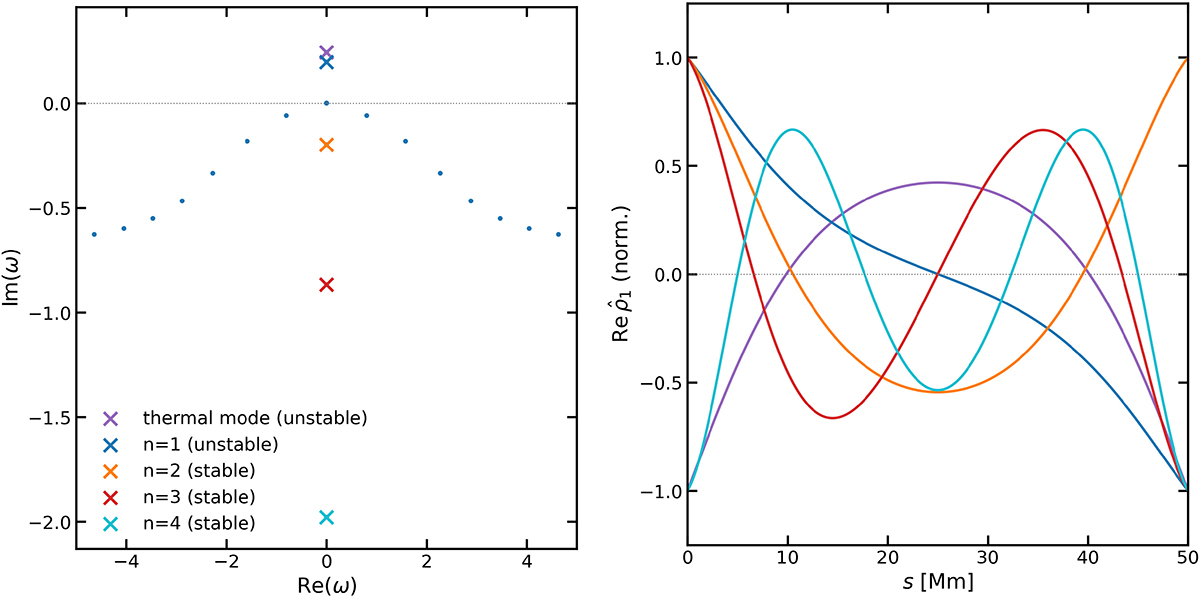
LEGOLAS spectrum for the equilibrium of Sect. 2.2 with Spitzer–Härm field-aligned thermal conduction, N = 400 grid points). Left: eigenvalue spectrum; the thermal continuum of Fig. 1 is replaced by discrete thermal modes (crosses) and the global thermal mode persists (purple marker). Blue dots are acoustic modes. Right: normalised density eigenfunctions, showing n nodes for the n-th mode.
Current usage metrics show cumulative count of Article Views (full-text article views including HTML views, PDF and ePub downloads, according to the available data) and Abstracts Views on Vision4Press platform.
Data correspond to usage on the plateform after 2015. The current usage metrics is available 48-96 hours after online publication and is updated daily on week days.
Initial download of the metrics may take a while.