


Fig. 1.
Download original image
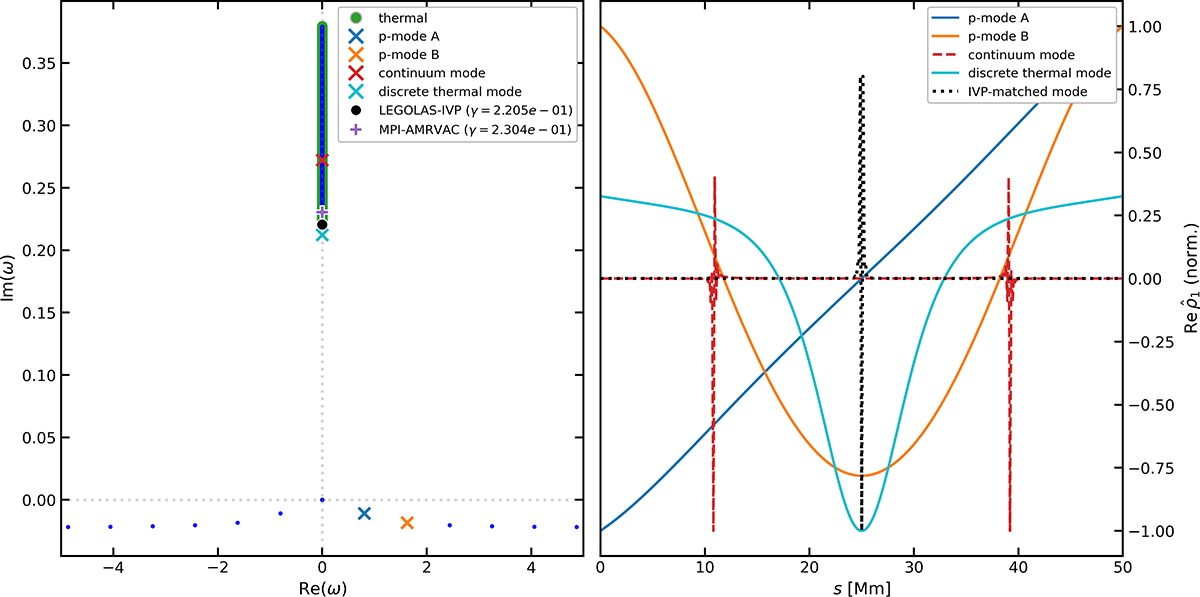
Linear spectrum and selected eigenfunctions for the thermally balanced 1D loop. Left: Eigenvalue spectrum obtained with LEGOLAS, showing acoustic modes, the thermal continuum, and an isolated discrete thermal mode. Blue dots denote individual eigenmodes. Selected modes are highlighted by coloured crosses: two acoustic p-modes (blue, orange), a thermal-continuum mode (red), and a discrete thermal mode (cyan). The measured growth rates obtained from LEGOLAS-IVP and MPI-AMRVAC for the isobaric perturbation (see Fig. 6) are overplotted as black and purple markers, respectively, on the ℜ(ω) = 0 axis. Right: Real parts of the corresponding density eigenfunctions along the loop coordinate s, normalised to unit amplitude. The coloured curves correspond to the four highlighted eigenmodes in the left panel. The black dotted curve shows the eigenfunction of the LEGOLAS mode whose eigenfrequency corresponds to the growth rate measured in the LEGOLAS-IVP simulation.
Current usage metrics show cumulative count of Article Views (full-text article views including HTML views, PDF and ePub downloads, according to the available data) and Abstracts Views on Vision4Press platform.
Data correspond to usage on the plateform after 2015. The current usage metrics is available 48-96 hours after online publication and is updated daily on week days.
Initial download of the metrics may take a while.