


Fig. B.1.
Download original image
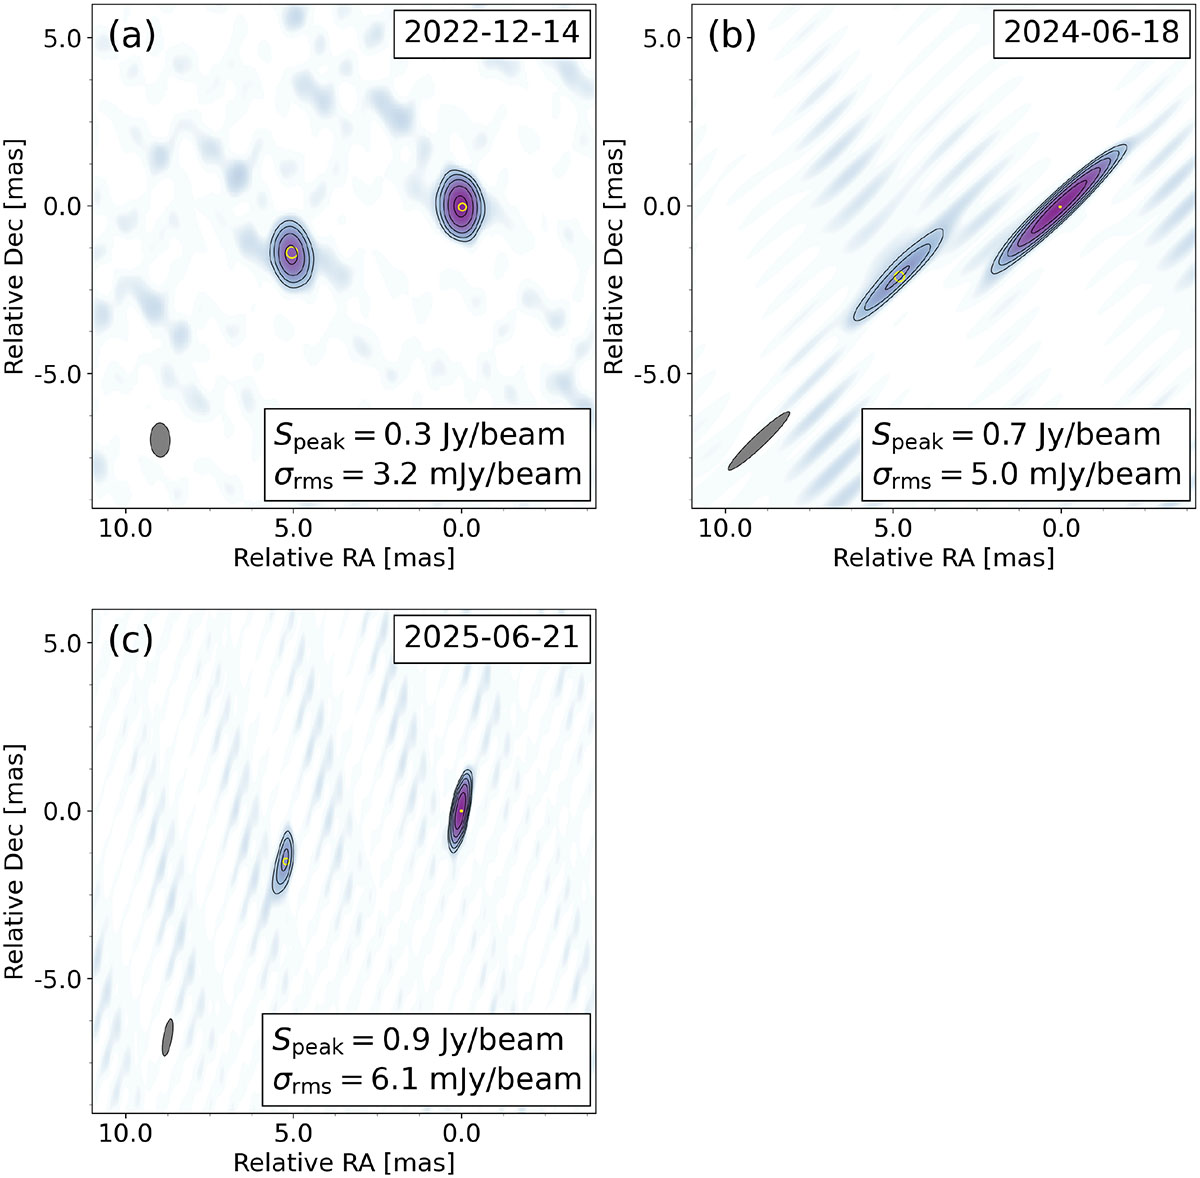
VLBA images of 3C 138 at 23.5 GHz obtained on 2022 December 14 (a), 2024 June 18 (b), and 2025 June 21 (c). Contours are drawn at ( − 1, 1, 2, 4, …) × 5σ, where σ is the image rms noise. The synthesized beam is shown in the lower-left corner of each panel. Yellow circles denote circular two-dimensional Gaussian model components. Their diameters represent the full widths at half maximum, and their centers mark the component positions.
Current usage metrics show cumulative count of Article Views (full-text article views including HTML views, PDF and ePub downloads, according to the available data) and Abstracts Views on Vision4Press platform.
Data correspond to usage on the plateform after 2015. The current usage metrics is available 48-96 hours after online publication and is updated daily on week days.
Initial download of the metrics may take a while.