


Fig. 2.
Download original image
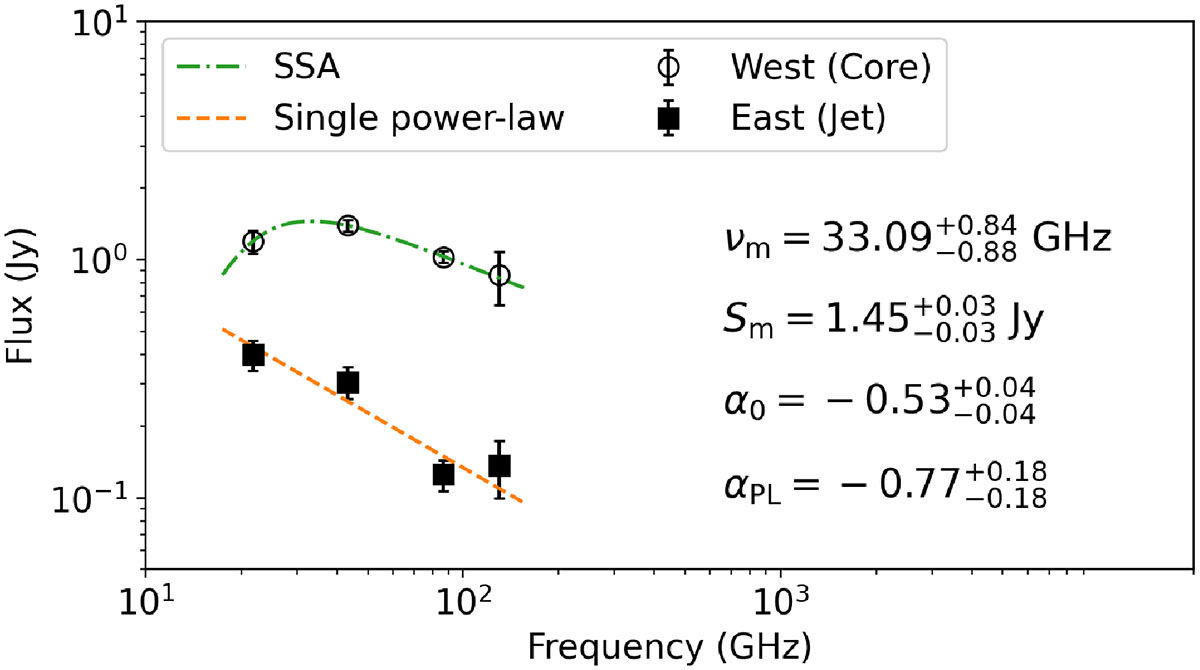
Spectra of the two KVN-resolved components in 3C 138 on 2024 December 12. Open circles denote the western component (core), fitted with an SSA model (dash-dotted green curve), with turnover frequency νm, peak flux density Sm, and optically thin spectral index α0. Filled squares denote the eastern component (jet knot), fitted with a PL model (dashed orange line) with spectral index αPL. Error bars indicate 1σ uncertainties.
Current usage metrics show cumulative count of Article Views (full-text article views including HTML views, PDF and ePub downloads, according to the available data) and Abstracts Views on Vision4Press platform.
Data correspond to usage on the plateform after 2015. The current usage metrics is available 48-96 hours after online publication and is updated daily on week days.
Initial download of the metrics may take a while.