


| Issue |
A&A
Volume 710, June 2026
|
|
|---|---|---|
| Article Number | A216 | |
| Number of page(s) | 7 | |
| Section | The Sun and the Heliosphere | |
| DOI | https://doi.org/10.1051/0004-6361/202659652 | |
| Published online | 22 June 2026 | |
A nominally confined X6.4 flare associated with an extremely faint coronal mass ejection
1
State Key Laboratory of Solar Activity and Space Weather, National Astronomical Observatories, Chinese Academy of Sciences, A20 Chaoyang District, Beijing 100101, China
2
University of Chinese Academy of Sciences, Beijing 100049, China
★ Corresponding author: This email address is being protected from spambots. You need JavaScript enabled to view it.
Received:
1
March
2026
Accepted:
6
May
2026
Abstract
Context. The observational distinction between eruptive and confined solar flares is often based on whether a coronal mass ejection (CME) can be identified in coronagraph data. However, CME detectability depends strongly on viewing geometry, coronal background, and instrumental sensitivity, so some physically eruptive events may appear confined during routine inspection.
Aims. We investigate the physical nature of a confined-like X6.4 flare that occurred on 2024 February 22 in NOAA Active Region 13590 and examine why its associated CME is exceptionally faint in coronagraph observations.
Methods. We analyzed the event using multiwavelength observations from SDO/AIA, SDO/HMI, CHASE Hα, GOES-16, SOHO/LASCO, and complementary STEREO-A data. We furthermore employed differential emission measure (DEM) diagnostics and nonlinear force-free field (NLFFF) extrapolations to characterize the thermal and magnetic structure of the eruption.
Results. The event occurred in a magnetically complex active region containing at least three eruptive branches rooted along distinct polarity inversion lines (PILs1–3). Flare brightening first appeared near PIL2, indicating that this branch was involved in triggering the X6.4 flare. However, only the branch associated with PIL1 escaped successfully and produced an extremely faint CME, whereas the branches associated with PIL2 and PIL3 failed and fell back to the solar surface. The successful eruption propagated eastward and was accompanied by pronounced coronal dimming and a fast extreme ultraviolet front, while the failed branches remained confined beneath stronger overlying closed fields. Filamentary structures, hot-channel signatures, DEM results, and NLFFF extrapolations together suggest the presence of three flux-rope-like configurations along the three PILs. The faint CME first becomes identifiable in LASCO only after careful discrimination from repeated backside eruptions using complementary viewpoints.
Conclusions. This event shows that a major flare may appear nominally confined during routine coronagraph inspection while still being physically associated with a CME. In this case, the flare-triggering branch and the CME-producing branch are not the same eruptive component, but belong to a sympathetic sequence in a complex active region. Our results highlight how a flare–CME association can be obscured by both magnetic complexity and CME detectability, and they emphasize the need for multiwavelength and multi-viewpoint diagnostics when assessing whether apparently confined major flares are truly noneruptive.
Key words: Sun: activity / Sun: atmosphere / Sun: coronal mass ejections (CMEs) / Sun: flares / Sun: magnetic fields / Sun: UV radiation
© The Authors 2026
 Open Access article, published by EDP Sciences, under the terms of the Creative Commons Attribution License (https://creativecommons.org/licenses/by/4.0), which permits unrestricted use, distribution, and reproduction in any medium, provided the original work is properly cited.
This article is published in open access under the Subscribe to Open model. This email address is being protected from spambots. You need JavaScript enabled to view it. to support open access publication.
1. Introduction
Solar flares and coronal mass ejections (CMEs) are among the most energetic manifestations of magnetic free-energy release in the solar atmosphere and are major drivers of severe space weather (Kahler 1992; Zhou et al. 2003, 2006). Despite decades of observational and theoretical progress, several key issues remain unresolved, including how magnetic free energy is stored and rapidly released, how it is partitioned into heating, bulk motions, and nonthermal particles, and how magnetic topology regulates whether an eruption remains confined or escapes into interplanetary space (e.g., Benz 2017; Zhou 2025). Within this broader context, one persistent challenge is the reliable identification of flare–CME associations.
Solar flares are often categorized observationally as eruptive events accompanied by CMEs and confined events without CMEs (Svestka et al. 1992; Li et al. 2022b). This distinction is often interpreted as a competition between the upward driving of a sheared or twisted core field – often described as a flux rope (FR) – and the downward magnetic tension of the overlying coronal field (e.g., Ji et al. 2003; Wang & Zhang 2007; Zhou et al. 2016; Liu et al. 2016). In this picture, an eruption occurs when the restraining overlying field is either sufficiently weak or decreases rapidly with height; however, it fails when the confinement remains too strong.
Nevertheless, the observational eruptive–confined dichotomy is not always equivalent to a physical one. Whether a CME is recognized in coronagraph observations depends not only on whether mass actually escapes, but also on Thomson-scattering geometry, propagation direction, coronal background, and instrumental sensitivity. As a result, Earth-directed, low-mass, or otherwise faint CMEs can be missed or only ambiguously identified in white-light data. Indeed, Wang et al. (2011) showed that a substantial fraction of CMEs may be absent from standard coronagraph-based catalogs. Conversely, Cheng et al. (2026) showed that some apparently confined flares may in fact be pseudo-confined, in the sense that they are associated with successive ejections revealed by Doppler-velocity signatures. Consequently, some flares may appear confined during routine inspection even though a weak ejection is physically present. This ambiguity is important for both flare physics and space-weather forecasting, because geoeffectiveness depends not on whether the associated CME is easily cataloged but on actual interplanetary ejecta (Wang et al. 2006).
A related observational difficulty is posed by stealth CMEs, which are identifiable in coronagraph observations but exhibit weak or absent low-coronal signatures such as dimmings, extreme ultraviolet (EUV) waves, filament eruptions, flares, and post-flare loops (Ma et al. 2010; D’Huys et al. 2014; Teng et al. 2024). These events show that both CME visibility in white light and eruptive visibility on the disk are not always tightly coupled. Motivated by this analogy, we consider the opposite observational situation here: a flare that is obvious on the disk, but whose CME counterpart is so faint in coronagraph data that the event can be easily mistaken for a confined flare. In this work, we use the phrase “confined-like” or “nominally confined” flare to describe such an event, without attempting to introduce a strict, new classification.
The problem becomes even more complex in magnetically intricate active regions. In standard flare–CME models, magnetic energy accumulates in highly sheared and twisted fields rooted along one or more polarity inversion lines (PILs), and the system erupts once it loses equilibrium or becomes magnetohydrodynamically unstable (e.g., Carmichael 1964; Kopp & Pneuman 1976; Lin et al. 1998; Shibata & Magara 2011; Schmieder et al. 2015). In complex active regions or active-region nests (Wang et al. 2015), however, multiple FRs or FR-like branches may coexist at different locations or heights and may interact or erupt sympathetically (e.g., Hou et al. 2018; Dhakal et al. 2018; Zheng et al. 2021; Zhou et al. 2019; Hou et al. 2023). In such cases, one branch may trigger the flare, another may fail, and yet another may escape and produce a CME. The flare-triggering branch and the CME-producing branch therefore need not be the same magnetic system. This possibility is especially important when interpreting major flares that appear confined but occur in highly structured active regions.
In this paper, we analyze the X6.4 flare that occurred in NOAA Active Region 13590 on 2024 February 22. At first sight, the event appears confined or at least confined-like, because no obvious CME counterpart is identifiable during the routine inspection of coronagraph data. However, careful analysis of multiwavelength observations and complementary viewpoints reveals that the flare was in fact associated with an extremely faint CME. The event occurred in a magnetically complex active region containing multiple eruptive branches along different PILs. The observations indicate that the branch responsible for triggering the X6.4 flare remained confined, whereas a sympathetic branch elsewhere in the same active region escaped and generated the faint CME.
The novelty of this study lies not in proposing a new taxonomic class of flares, but in observationally showing that a major flare may be misclassified as confined when its associated CME is exceptionally faint, and that, in a complex active region, the flare-triggering and CME-producing branches may belong to different sympathetic eruptive components. This event therefore provides a useful example of how a flare–CME association can be obscured by both magnetic complexity and CME detectability. In the following sections, the observations and analysis are presented in Sect. 2, followed by a discussion and conclusions in Sect. 3.
2. Observations and results
The eruption on 2024 February 22 was well observed over a broad range of atmospheric layers and vantage points. The Atmospheric Imaging Assembly (AIA; Lemen et al. 2012) on board the Solar Dynamics Observatory (SDO; Pesnell et al. 2012) provides successive EUV observations in ten passbands with a spatial resolution of 1.5″. The Helioseismic and Magnetic Imager (HMI; Scherrer et al. 2012) offers full-disk line-of-sight (LOS) magnetograms and dopplergrams with the spatial resolution of 1″ every 45 s. Observations from the Chinese Hα Solar Explorer (CHASE; Li et al. 2022a) were analyzed to check the related filament channel. The flare evolution was characterized using GOES-16 soft X-ray flux in the 1–8 Å and 0.5–4 Å bands. Coronal mass ejection signatures were investigated with the Large Angle and Spectrometric Coronagraph (LASCO; Brueckner et al. 1995) on board the Solar and Heliospheric Observatory (SOHO; Domingo et al. 1995). We additionally used Solar TErrestrial RElations Observatory (STEREO; Kaiser et al. 2008) observations as a complementary viewpoint to help distinguish the faint CME associated with the X6.4 flare from unrelated far-side or behind-the-limb eruptions contributing to the coronagraph signatures seen from Earth.
We examined the thermal structure of the eruption by deriving the temperature distribution and emission measure using a differential emission measure (DEM) analysis (Cheung et al. 2015; Su et al. 2018). The 3D coronal topology over NOAA Active Region (AR) 13590 was constructed using nonlinear force-free field (NLFFF) extrapolations (e.g. Wiegelmann 2008). The aim of this section is to establish three observational points: (1) the event occurred in a magnetically complex active region containing multiple eruptive branches; (2) the X6.4 flare was triggered near one branch, while the faint CME was produced from another; and (3) the event therefore appeared confined during routine inspection, despite being physically eruptive.
2.1. Overview of the X6.4 flare on 2024 February 22
NOAA AR 13590 appeared at the eastern limb on 2024 February 18 and crossed the visible disk during a period of strong activity. On 2024 February 22, the region was located at approximately N17E27 at 22:00 UT, when it produced the X6.4 flare studied here. Figure 1 provides an overview of the magnetic and thermal structure of the source region. The HMI LOS magnetogram in Fig. 1(a) shows a complex multipolar magnetic configuration. In the enlarged view, three main PILs (PIL1–PIL3) can be identified between the heavily smoothed LOS contours. In the corresponding CHASE Hα image (Figure 1(b)), dark filamentary channels are seen along these PILs.
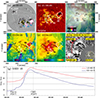 |
Fig. 1. Overview of the X6.4 flare on 2024 February 22. (a) SDO/HMI LOS magnetogram at 22:00 UT. The initiating region, AR 13590, is outlined by the white box at upper left. The enlarged inset (bottom) highlights three PILs (dashed cyan curves) indicating three eruptions (ER1–ER3). The LOS field contours at ±300 G after heavy smoothing are overplotted (red/yellow in panel (a); white/black in panels (b, d, and e)). (b) CHASE Hα image showing three dark filament channels co-aligned with the PILs. (c) AIA composite image (171, 211, and 131 Å) revealing enhanced EUV emission as bundled loops along PIL1–PIL3. A null-point-like topology appears above their northern footpoints. (d) DEM-derived temperature map indicating elevated temperatures along PIL1–PIL3. (e) DEM-derived emission measure map showing enhanced plasma content along the same structures. (f) SOHO/LASCO-C2 coronagraph image at ∼00:48 UT on 2024 February 23, obtained by subtracting the image at ∼00:36 UT. The image reveals the studied faint CME, which is clearly identifiable within a narrow intensity range; the red dashed curve outlines its front. The bottom-right image in panel (f) shows the EUV difference image over the same time interval at 335 Å from SDO/AIA. GOES-16 soft X-ray fluxes (1–8 Å, red; 0.5–4 Å, blue) indicate an X6.4 flare that began at 22:08 UT, peaked at 22:34 UT, and ended at 22:43 UT. The white boxes in panels (a) denote the fields of view of panels (b-f). |
For clarity, we first define the terminology used throughout this paper. The eruptions occurring along PIL1–PIL3 are referred to as Eruptions 1–3 (ER1–ER3), respectively. The possible FR-like structures associated with PIL1–PIL3 are referred to as FR1–FR3, respectively. Thus, PIL1–PIL3 mark the locations of ER1–ER3 and the corresponding FR1–FR3.
The overlying coronal structure is revealed by the AIA EUV observations. In the AIA three-color composite image shown in Fig. 1(c), bundles of bright coronal loops are rooted along PIL1–PIL3. These EUV loop systems spatially correspond to the filament channels seen in Hα, and some portions also show hot-channel-like signatures in the 131 and 335 Å passbands. The DEM temperature and emission-measure maps in Figs. 1(d) and 1(e) indicate elevated temperatures and enhanced plasma content along these structures. Taken together, these observations are consistent with three FR-like or strongly sheared eruptive configurations rooted along the three PILs, although the exact magnetic nature of each structure cannot be uniquely determined from imaging data alone.
The GOES-16 soft X-ray fluxes show that the flare began at 22:08 UT, peaked at 22:34 UT, and ended at 22:43 UT (Figure 1(g)). Despite the large flare magnitude, the associated CME is extremely faint in white-light coronagraph observations. A weak outward-moving feature becomes identifiable in LASCO/C2 only after careful differencing and contrast adjustment, as shown in Fig. 1(f), where a clear signature appeared around 00:48 UT on 2024 February 23. This weak CME first appeared at ∼23:48 UT on 2024 February 22 and was excluded from standard CME catalogs. The combination of a major disk flare and an exceptionally faint coronagraph counterpart already suggests that this event is neither a typical confined flare nor a straightforward eruptive event during routine coronagraph inspection.
2.2. Discrimination of the faint CME from unrelated backside eruptions
Because the faint CME is difficult to recognize in LASCO images, it is essential to distinguish it from unrelated eruptions occurring elsewhere on the Sun. Figure 2 summarizes this discrimination procedure.
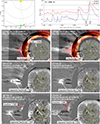 |
Fig. 2. Identification of the studied faint CME and its distinction from backside eruptions. (a) Schematic showing the relative positions of the Sun (yellow), Earth (green), and STEREO-A (STA; red). (b) GOES-16 soft X-ray fluxes (1–8 Å, red; 0.5–4 Å, blue), indicating a quiescent period around 15:00 UT prior to the onset of the X6.4 flare. (c–d) Backside eruption observed in difference coronagraph images from SOHO/LASCO-C2 (outermost gray) and STA/COR1 (middle red), together with a 284 Å EUV difference image from STEREO-A at 16:36 UT, obtained after 15:00 UT subtraction, when no eruptive activity was present on the solar front side. (e–f) Repeated backside eruption originating from the same location, shown in difference coronagraph images from LASCO-C2 (outermost gray) and in 284 Å EUV difference images from STEREO-A at 23:12 UT prior to the appearance of the X6.4-flare-related CME, derived using the same 15:00 UT reference time. (g) Difference coronagraph image from LASCO-C2 (outermost gray) and a corresponding 284 Å EUV difference image at 23:48 UT on 2024 February 22, obtained after 15:00 UT subtraction. (h) Same as panel (g) but for the interval 00:24–00:00 UT on 2024 February 23. The CME associated with the X6.4 flare first appears at ∼23:48 UT and continues propagating at 00:24 UT on 2024 February 23, as indicated by the red arrows and the arc. The white circles outline the solar disk. |
As shown schematically in Fig. 2(a), STEREO-A was displaced from the Sun–Earth line and provided a complementary viewpoint to the Earth-based observations. We emphasize that the role of STEREO-A in this study is not to “directly observe the same eastern limb from a wider field of view”, but rather to help identify far-side or behind-the-limb activity that may contribute to the apparent eastward coronagraph signatures seen from Earth. This helps distinguish the extremely faint CME associated with the X6.4 flare from unrelated backside eruptions.
The GOES–16 soft X-ray curves in Fig. 2(b) indicate that the solar front side remained relatively quiet around 15:00 UT on 2024 February 22, before the onset of the X6.4 flare. We therefore selected 15:00 UT as the reference time for constructing base-difference (BD) images. Figure 2, panels c and d show that a backside eruption had already produced an eastward-propagating CME signature well before the X6.4 flare. The corresponding STEREO-A 284 Å difference images show eruptive activity beyond the visible front-side disk, supporting its far-side origin.
Figure 2, panels e and f further show that similar backside activity recurred later, producing repeated eastward signatures in the coronagraph data. Only after carefully accounting for these unrelated signatures does the CME associated with the X6.4 flare become distinguishable. It first appeared at ∼23:48 UT and continued into 00:24 UT on 2024 February 23 as indicated in Fig. 2, panels g–h. This analysis demonstrates that the CME associated with the X6.4 flare is real but extremely faint, and that it can be easily overlooked or confused with unrelated backside eruptions without the aid of complementary observations.
2.3. Sympathetic eruptive activity along PIL1–PIL3
The EUV observations show that the X6.4 flare was not produced by a single simple eruptive branch, but by a sympathetic sequence involving at least three eruptive components rooted along PIL1–PIL3. Figure 3 presents the evolution in AIA 131 Å, which is particularly sensitive to hot flare plasma.
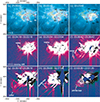 |
Fig. 3. EUV evolution of ER1–ER3 shown in AIA 131 Å. Top: 131 Å images. (a) PIL1–PIL3 and the neighboring magnetic null-point structure prior to the X6.4 flare. (b) ER2 first occurring at about 22:02 UT. (c) ER3 occurring about 20 min later at ∼22:23 UT. Middle and bottom: Running-difference 131 Å images highlighting the flare-associated CME. (d) ER1 showing a writhed structure (white arrow) at the onset. (e) Expansion of loops overlying PIL1. (f–g) Prominent ejecta. (h–i) Apparent late-phase post-flare loops. Movie 1 shows the corresponding 131 Å evolution of ER1–ER3. The associated movie is available online. |
Before the flare, enhanced 131 Å emission outlines the three main eruptive branches above PIL1–PIL3 (Fig. 3(a)). A null-like coronal structure is visible above the northern part of the system. The earliest flare brightening appears near PIL2 (Fig. 3(b)), indicating that the branch associated with PIL2 is directly involved in triggering the X6.4 flare. Shortly afterward, activity spreads to the branches associated with PIL3 and PIL1, showing that the event evolves as a sympathetic eruption rather than as an isolated single-PIL flare.
The subsequent evolution reveals different outcomes for the three branches. Figure 3 panels d to i show a time sequence of 131 Å running-difference images that highlights ER1, the branch associated with PIL1. ER1 begins to rise prominently at ∼22:24 UT, about 16 min after the flare onset, and then propagates eastward away from the source region (Fig. 3(d–g)). The early eruption exhibits a strongly writhed morphology and rapidly expands with the overlying loops (Fig. 3(e)). The branch associated with PIL1 then ejects eastward and successfully propagates away from the Sun (Fig. 3(f–g)). In the late phase, post-flare loops form above PIL1 (Fig. 3(h–i)), supporting the interpretation that this branch undergoes a successful eruption. By contrast, the activity near PIL2 and PIL3 remains confined to lower heights and does not show comparable evidence for escape.
These observations indicate that the branch involved in the flare onset and the branch that eventually produces the CME are not the same eruptive component. Rather, the flare is initiated near PIL2, while the successful escaping branch is associated with PIL1. This distinction is central to the physical interpretation of the event.
2.4. Coronal dimming and identification of the escaping branch
Coronal dimming provides an additional diagnostic for distinguishing the escaping and failed branches. Figure 4 shows BD images in AIA 211 and 335 Å obtained by subtracting the pre-eruption image at 22:00 UT.
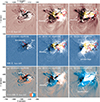 |
Fig. 4. Eruptive activity of ER1 in BD images at different moments after 22:00 UT subtraction, before the sympathetic eruptions. Top: 211 Å BD images. (a) Initial dimming in the null–point topology (red arrow). (b) X-class flare igniting at ER2’s location (black arrow). (c) Large dimming developing over the eastern part of AR 13590. Middle: BD images in 335 Å. As in the 211 Å sequence, early dimming forms around the null-point topology, and ER2 initiates the flare (d-e). (f) Post-flare loops accompanying the extensive dimming and intense flare. LOS magnetic-field contours at ±350 G (after heavy smoothing) are overplotted in red and yellow in (b-c, e-f). Bottom: 211/335 Å composites, highlighting the locations of prominent coronal dimming and flaring. Red and blue represent the EUV structural response to different temperatures revealed at 211 and 335 Å, respectively. Movie 2 shows the corresponding BD and composite EUV evolution. The associated movie is available online. |
Different observations assembled in Fig. 4 delineate the regions of coronal dimming and flare-related brightenings. The earliest dimming appears near the null-like coronal structure in both passbands (Fig. 4, panels (a) and (d). As the eruption proceeds, the dimming becomes concentrated mainly to the east of AR 13590, while the western part of the active region is dominated by flare brightenings. This eastward dimming is especially clear in 335 Å (Fig. 4(d–f)), whereas the western side shows little comparable dimming in that hotter channel. The 211/335 Å composite BD images in Fig. 4 panels g–i provide a consistent picture: the most prominent dimming is associated with the branch that propagates eastward, while the strongest brightenings are associated with the branches that remain near the flare core.
Coronal dimming is widely regarded as an indirect signature of successful mass ejection. Harra et al. (2016) investigated 42 solar X-class flares between February 2011 and November 2014, nine of which were not associated with CMEs. They find that whether an X-class flare is eruptive shows little dependence on many properties–including active-region size, sunspot area, and flare duration–except for one key feature: coronal dimming as detected in EUV spectral lines. Enhanced EUV emission can reflect plasma heating due to flare energy release; however, it can also indicate that overlying coronal loops remain closed, blocking mass escape. We therefore use the dimming morphology as one of the key observational criteria for identifying the CME-producing branch. In the present event, its spatial distribution strongly supports the conclusion that the branch associated with PIL1 is the escaping component, whereas the activity near PIL2 and PIL3 is predominantly confined.
2.5. Contrasting evolution of the escaping and failed branches
To further compare the eruptive outcomes, we constructed time–distance diagrams along two representative directions, as shown in Fig. 5. The slice S1–S2 follows the propagation direction of the escaping branch, while S3–S4 samples the direction along which the other branches remain confined beneath predominantly closed fields.
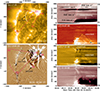 |
Fig. 5. Time-slice images showing the successive and failed mass ejections in one event. (a) 171 Å image showing open magnetic field lines dominating the sector “S1–S2” sampling the escaping branch. (b) 193 Å BD image after 22:29 UT subtraction, highlighting successful eruptions along “S1–S2”. The dashed white line traces the eruption-associated wave front. By contrast, “S3–S4” samples the confined branches to explain failed mass ejections. (c) Time-distance plot of 211 Å BD emission (base time 22:29 UT) along “S1–S2”. Piecewise linear fits yield phase speeds that increase from 314 km s−1 to 640 km s−1, then decrease to 259 km s−1. Coronal dimming accompanies the eruption. (d–f) Time-distance evolution of BD emission in 304, 171, and 211 Å along “S3–S4”, respectively. The straight and curved white arrows indicate the failed ejecta falling back toward the Sun. |
As shown in Fig. 5(a–b), a sector “S1–S2” is selected along the propagation direction of ER1, which is consistent with an open-field corridor. A second slice, “S3–S4”, is placed along the projected eruption path of ER2 and ER3, where the overlying field is predominantly closed. Along S1–S2, the BD images reveal a fast outward-moving front ahead of the escaping branch. The corresponding time–distance diagram in Fig. 5(c) shows an initial propagation speed of about 314 km s−1, followed by acceleration to about 640 km s−1 and then deceleration to about 259 km s−1 as the front encounters neighboring active regions near the limb. Coronal dimming develops in the wake of this outward propagation, further supporting the interpretation of a successful ejection.
In contrast, the branches sampled along S3–S4 do not exhibit sustained outward propagation. Instead, Fig. 5 panels (d)–(f) show repeated signatures of plasma returning toward the solar surface. The confined ejecta appears bright in 304 Å, only weakly enhanced in 171 Å, and dark in 211 Å. It suggests that the temperature of the failed ejecta lies between the typical temperatures sampled by the 304 Å and 171 Å channels, i.e., between (5.0 × 10⁴) and (6.3 × 10⁵) K. In comparison, the escaping front of ER1 is likely heated to higher temperatures, as its outward propagation is accompanied by a persistently bright leading front in 211 Å. These observational differences support the view that the PIL2 and PIL3 branches undergo failed eruptions, whereas the PIL1 branch escapes and produces the faint CME.
2.6. Magnetic structure inferred from NLFFF extrapolation
Based on the NLFFF extrapolation, the eruptive structures associated with the X6.4 flare in AR 13590 can be investigated. Figure 6 presents the NLFFF extrapolation results. Three FR-like structures, labeled FR1–FR3, are found along the three PILs and are rendered in cyan, gray, and green, respectively. Two null-like coronal structures are also present above the system. An alternative viewing angle in Fig. 6(b) further highlights the magnetic interconnections among FR1–FR3.
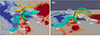 |
Fig. 6. NLFFF extrapolations showing the erupting FR structures (FR1–FR3) corresponding to “ER1–ER3”. The background is the LOS magnetogram saturated at ±350 G (red: positive polarity; blue: negative). FR1–FR3 are rendered in cyan, gray, and green, respectively. The purple contours delineate regions of high free magnetic energy density (95% of the maximum). Panel (b) shows the same topology from an alternative viewing angle. |
Following the method of Chen & Wang (2012), we computed the free magnetic energy density in AR 13590 with ρfree = |B0 − Bp|2/8π, where B0 and Bp are the observed and potential magnetic fields, respectively, and ρfree is in units of erg cm−3. The potential magnetic field Bp is extrapolated from the observed magnetogram using the fast Fourier transform method. The resulting free magnetic energy density, ρfree, reaches peak values of up to 2.4 × 10⁵ erg cm−3. Regions of enhanced free magnetic energy density are concentrated around the three FR-like branches.
The extrapolation does not uniquely prove that these structures are fully developed FRs, nor does it directly determine which branch successfully erupts. Nevertheless, when combined with the filament channels seen in Hα, the hot-channel-like EUV signatures, the DEM diagnostics, and the observed eruptive behavior, the magnetic extrapolation supports a picture in which multiple FR-like branches coexist and interact within the active region.
In particular, the extrapolated magnetic environment is consistent with the observational conclusion that different branches experience different confinement conditions. The branch associated with PIL1 appears favorably oriented for escape toward the east, whereas the branches associated with PIL2 and PIL3 remain embedded beneath more strongly closed overlying structures. We stress, however, that this should be regarded as a physically plausible interpretation supported by the data, rather than as a uniquely demonstrated magnetic solution.
3. Discussion and conclusions
Our analysis of the 2024 February 22 X6.4 flare in NOAA AR 13590 suggests that this event is best described as nominally confined or confined-like, rather than truly confined. During routine coronagraph inspection, the event would be easily classified as confined because its CME counterpart is exceptionally faint and is further complicated by unrelated backside eruptions. However, after combining multiwavelength EUV observations, coronal dimming diagnostics, and complementary viewpoints, we find that the event is in fact associated with a real but extremely faint CME. This result highlights an important practical limitation of the conventional eruptive and confined classification when CME detectability is poor.
A central result of this study is that the flare-triggering branch and the CME-producing branch do not appear to be the same eruptive component. The earliest flare brightening is observed near PIL2, indicating that the branch associated with PIL2 was directly involved in triggering the X6.4 flare. However, the branch that clearly escaped and produced the faint CME is that associated with PIL1. By contrast, the branches associated with PIL2 and PIL3 exhibit failed eruptions and falling material returning to the solar surface. In this sense, the event is not a simple one-branch eruption, but rather a sympathetic sequence involving multiple eruptive branches embedded in a magnetically complex active region.
The EUV observations provide several lines of evidence supporting this interpretation. First, the branch associated with PIL1 shows a clear outward propagation and is followed by pronounced coronal dimming, both of which are commonly regarded as signatures of successful mass ejection. Second, the time–distance analysis along the propagation direction of this branch reveals a fast EUV front and sustained outward motion. Third, the branches associated with PIL2 and PIL3 do not show comparable evidence for escape; rather, they are characterized by confined ejecta and clear fallback signatures. Taken together, these observations strongly suggest that the successful ejection is associated with the PIL1 branch, whereas the PIL2 and PIL3 branches remain confined.
The magnetic interpretation is necessarily more tentative. Based on the combination of Hα filament channels, hot-channel-like EUV structures, DEM results, and NLFFF extrapolations, we detect three FR-like configurations along PIL1–PIL3. We intentionally describe these structures as flux-rope-like, because the exact identification of a fully developed FR remains model dependent and is not uniquely determined by the present observations. The NLFFF extrapolation further suggests that these structures are magnetically interconnected and embedded in a complex coronal topology involving two null-like features.
A plausible interpretation is that the different eruptive outcomes were controlled, at least in part, by differences in the overlying magnetic environment. The branch associated with PIL1 appears to erupt toward a less confining direction, as suggested by its eastward propagation, the associated large-scale dimming, and the open-field-like corridor visible in the EUV images. By contrast, the branches associated with PIL2 and PIL3 appear to remain under stronger overlying closed fields. This interpretation is consistent with the observations, but it is not uniquely demonstrated by the present data. Other factors may also contribute, including differences in pre-eruption magnetic stress, current helicity buildup, or eruption onset conditions, as suggested by recent numerical studies (Vashishtha et al. 2025). We therefore regard the overlying-field explanation as a physically plausible scenario rather than definitive proof.
The faintness of the associated CME likely results from a combination of factors. First, the CME itself is intrinsically weak in coronagraph observations. Second, the event occurred in a geometrically unfavorable context, where the white-light signature can be reduced by projection and Thomson-scattering effects. Third, the coronagraph images were contaminated by repeated backside eruptions, making the CME especially easy to overlook without careful discrimination using complementary data. The present event therefore illustrates that the absence of an obvious cataloged CME does not necessarily imply the absence of a true eruption.
This case also has a broader implication for flare–CME association in complex active regions. In many events, the eruptive and confined label is implicitly assigned by asking whether the flare-triggering structure itself escapes. Our observations show that this approach can be incomplete in multi-PIL systems. A branch that triggers the flare may remain confined, while another sympathetic branch within the same active region may escape and generate a CME. In such a situation, the event may appear confined if only the flare onset site is considered, yet it is physically eruptive when the full active-region-scale evolution is taken into account. We therefore suggest caution when applying the confined terminology to major flares in magnetically complex active regions, especially when the coronagraph signature is weak.
In summary, we have analyzed an X6.4 flare that appeared confined during routine inspection but was in fact associated with an extremely faint CME. The event occurred in a complex active region containing at least three sympathetic eruptive branches rooted along distinct PILs. The flare was triggered near PIL2; however, the branch associated with PIL1 escaped successfully, resulting in the faint CME, whereas those associated with PIL2 and PIL3 failed. This event demonstrates that the flare–CME association can be obscured by both magnetic complexity and limited CME detectability. It further shows that a confined–like appearance does not necessarily imply a truly noneruptive event. Multiwavelength EUV observations, coronal dimming diagnostics, and multi-viewpoint analysis are therefore essential for identifying such events and for improving our physical understanding of flare–CME relationships in complex active regions.
Data availability
Movies associated to Figs. 3 and 4 are available at https://www.aanda.org
Acknowledgments
The work is supported by the National Key R&D Program of China (2022YFF0503800), the Strategic Priority Research Program of the Chinese Academy of Sciences (XDB0560000), the State Key Program of National Natural Science Foundation of China (12533010), the National Natural Science Foundation of China (12403067, 12350004, 12373111, 12273061, 12273060, 12473095, 12573056, 12503064, 12503062), and the Specialized Research Fund for State Key Laboratory of Solar Activity and Space Weather.
References
- Benz, A. O. 2017, Liv. Rev. Sol. Phys., 14, 2 [Google Scholar]
- Brueckner, G. E., Howard, R. A., Koomen, M. J., et al. 1995, Sol. Phys., 162, 357 [NASA ADS] [CrossRef] [Google Scholar]
- Carmichael, H. 1964, in The Physics of Solar Flares, ed. W. N. Hess, NASA SP-50, 451 [Google Scholar]
- Chen, A. Q., & Wang, J. X. 2012, A&A, 543, A49 [NASA ADS] [CrossRef] [EDP Sciences] [Google Scholar]
- Cheng, Z., Song, A., Zhou, G., et al. 2026, ApJ, 997, 242 [Google Scholar]
- Cheung, M. C. M., Boerner, P., Schrijver, C. J., et al. 2015, ApJ, 807, 143 [Google Scholar]
- Dhakal, S. K., Chintzoglou, G., & Zhang, J. 2018, ApJ, 860, 35 [Google Scholar]
- D’Huys, E., Seaton, D. B., Poedts, S., & Berghmans, D. 2014, ApJ, 795, 49 [Google Scholar]
- Domingo, V., Fleck, B., & Poland, A. I. 1995, Sol. Phys., 162, 1 [Google Scholar]
- Harra, L. K., Schrijver, C. J., Janvier, M., et al. 2016, Sol. Phys., 291, 1761 [NASA ADS] [CrossRef] [Google Scholar]
- Hou, Y. J., Zhang, J., Li, T., et al. 2018, A&A, 619, A100 [NASA ADS] [CrossRef] [EDP Sciences] [Google Scholar]
- Hou, Y., Li, C., Li, T., et al. 2023, ApJ, 959, 69 [NASA ADS] [CrossRef] [Google Scholar]
- Ji, H., Wang, H., Schmahl, E. J., et al. 2003, ApJ, 595, L135 [Google Scholar]
- Kahler, S. W. 1992, ARA&A, 30, 113 [NASA ADS] [CrossRef] [Google Scholar]
- Kaiser, M. L., Kucera, T. A., Davila, J. M., et al. 2008, Space Sci. Rev., 136, 5 [Google Scholar]
- Kopp, R. A., & Pneuman, G. W. 1976, Sol. Phys., 50, 85 [Google Scholar]
- Lemen, J. R., Title, A. M., Akin, D. J., et al. 2012, Sol. Phys., 275, 17 [Google Scholar]
- Li, C., Fang, C., Li, Z., et al. 2022a, Sci. China Phys. Mech. Astron., 65, 289602 [NASA ADS] [CrossRef] [Google Scholar]
- Li, T., Sun, X., Hou, Y., et al. 2022b, ApJ, 926, L14 [NASA ADS] [CrossRef] [Google Scholar]
- Lin, J., Forbes, T. G., Isenberg, P. A., & Démoulin, P. 1998, ApJ, 504, 1006 [NASA ADS] [CrossRef] [Google Scholar]
- Liu, L., Wang, Y., Wang, J., et al. 2016, ApJ, 826, 119 [NASA ADS] [CrossRef] [Google Scholar]
- Ma, S., Attrill, G. D. R., Golub, L., et al. 2010, ApJ, 722, 289 [NASA ADS] [CrossRef] [Google Scholar]
- Pesnell, W. D., Thompson, B. J., & Chamberlin, P. C. 2012, Sol. Phys., 275, 3 [Google Scholar]
- Scherrer, P. H., Schou, J., Bush, R. I., et al. 2012, Sol. Phys., 275, 207 [Google Scholar]
- Schmieder, B., Aulanier, G., & Vršnak, B. 2015, Sol. Phys., 290, 3457 [NASA ADS] [CrossRef] [Google Scholar]
- Shibata, K., & Magara, T. 2011, Living Rev. Sol. Phys., 8, 6 [Google Scholar]
- Su, Y., Veronig, A. M., Hannah, I. G., et al. 2018, ApJ, 856, L17 [NASA ADS] [CrossRef] [Google Scholar]
- Svestka, Z., Jackson, B. V., & Machado, M. E. 1992, in IAU Colloq. 133, Eruptive Solar Flares, Lect. Notes Phys., 399 [Google Scholar]
- Teng, W., Su, Y., Ji, H., et al. 2024, Nat. Commun., 15, 9198 [Google Scholar]
- Vashishtha, N., Pant, V., Talpeanu, D. C., et al. 2025, ApJ, 992, 59 [Google Scholar]
- Wang, Y., & Zhang, J. 2007, ApJ, 665, 1428 [Google Scholar]
- Wang, Y., Xue, X., Shen, C., et al. 2006, ApJ, 646, 625 [Google Scholar]
- Wang, Y., Chen, C., Gui, B., et al. 2011, J. Geophys. Res. Space Phys., 116, A04104 [Google Scholar]
- Wang, J., Zhang, Y., He, H., et al. 2015, Sci. China Phys. Mech. Astron., 58, 599601 [Google Scholar]
- Wiegelmann, T. 2008, J. Geophys. Res., 113, A03S02 [Google Scholar]
- Zheng, R., Zhang, L., Wang, B., et al. 2021, ApJ, 921, L39 [Google Scholar]
- Zhou, G. 2025, Nat. Astron., 9, 1105 [Google Scholar]
- Zhou, G., Wang, J., & Cao, Z. 2003, A&A, 397, 1057 [NASA ADS] [CrossRef] [EDP Sciences] [Google Scholar]
- Zhou, G. P., Wang, J. X., & Zhang, J. 2006, A&A, 445, 1133 [NASA ADS] [CrossRef] [EDP Sciences] [Google Scholar]
- Zhou, G. P., Zhang, J., & Wang, J. X. 2016, ApJ, 823, L19 [Google Scholar]
- Zhou, G. P., Tan, C. M., Su, Y. N., et al. 2019, ApJ, 873, 23 [Google Scholar]
All Figures
|
Fig. 1. Overview of the X6.4 flare on 2024 February 22. (a) SDO/HMI LOS magnetogram at 22:00 UT. The initiating region, AR 13590, is outlined by the white box at upper left. The enlarged inset (bottom) highlights three PILs (dashed cyan curves) indicating three eruptions (ER1–ER3). The LOS field contours at ±300 G after heavy smoothing are overplotted (red/yellow in panel (a); white/black in panels (b, d, and e)). (b) CHASE Hα image showing three dark filament channels co-aligned with the PILs. (c) AIA composite image (171, 211, and 131 Å) revealing enhanced EUV emission as bundled loops along PIL1–PIL3. A null-point-like topology appears above their northern footpoints. (d) DEM-derived temperature map indicating elevated temperatures along PIL1–PIL3. (e) DEM-derived emission measure map showing enhanced plasma content along the same structures. (f) SOHO/LASCO-C2 coronagraph image at ∼00:48 UT on 2024 February 23, obtained by subtracting the image at ∼00:36 UT. The image reveals the studied faint CME, which is clearly identifiable within a narrow intensity range; the red dashed curve outlines its front. The bottom-right image in panel (f) shows the EUV difference image over the same time interval at 335 Å from SDO/AIA. GOES-16 soft X-ray fluxes (1–8 Å, red; 0.5–4 Å, blue) indicate an X6.4 flare that began at 22:08 UT, peaked at 22:34 UT, and ended at 22:43 UT. The white boxes in panels (a) denote the fields of view of panels (b-f). |
| In the text | |
|
Fig. 2. Identification of the studied faint CME and its distinction from backside eruptions. (a) Schematic showing the relative positions of the Sun (yellow), Earth (green), and STEREO-A (STA; red). (b) GOES-16 soft X-ray fluxes (1–8 Å, red; 0.5–4 Å, blue), indicating a quiescent period around 15:00 UT prior to the onset of the X6.4 flare. (c–d) Backside eruption observed in difference coronagraph images from SOHO/LASCO-C2 (outermost gray) and STA/COR1 (middle red), together with a 284 Å EUV difference image from STEREO-A at 16:36 UT, obtained after 15:00 UT subtraction, when no eruptive activity was present on the solar front side. (e–f) Repeated backside eruption originating from the same location, shown in difference coronagraph images from LASCO-C2 (outermost gray) and in 284 Å EUV difference images from STEREO-A at 23:12 UT prior to the appearance of the X6.4-flare-related CME, derived using the same 15:00 UT reference time. (g) Difference coronagraph image from LASCO-C2 (outermost gray) and a corresponding 284 Å EUV difference image at 23:48 UT on 2024 February 22, obtained after 15:00 UT subtraction. (h) Same as panel (g) but for the interval 00:24–00:00 UT on 2024 February 23. The CME associated with the X6.4 flare first appears at ∼23:48 UT and continues propagating at 00:24 UT on 2024 February 23, as indicated by the red arrows and the arc. The white circles outline the solar disk. |
| In the text | |
|
Fig. 3. EUV evolution of ER1–ER3 shown in AIA 131 Å. Top: 131 Å images. (a) PIL1–PIL3 and the neighboring magnetic null-point structure prior to the X6.4 flare. (b) ER2 first occurring at about 22:02 UT. (c) ER3 occurring about 20 min later at ∼22:23 UT. Middle and bottom: Running-difference 131 Å images highlighting the flare-associated CME. (d) ER1 showing a writhed structure (white arrow) at the onset. (e) Expansion of loops overlying PIL1. (f–g) Prominent ejecta. (h–i) Apparent late-phase post-flare loops. Movie 1 shows the corresponding 131 Å evolution of ER1–ER3. The associated movie is available online. |
| In the text | |
|
Fig. 4. Eruptive activity of ER1 in BD images at different moments after 22:00 UT subtraction, before the sympathetic eruptions. Top: 211 Å BD images. (a) Initial dimming in the null–point topology (red arrow). (b) X-class flare igniting at ER2’s location (black arrow). (c) Large dimming developing over the eastern part of AR 13590. Middle: BD images in 335 Å. As in the 211 Å sequence, early dimming forms around the null-point topology, and ER2 initiates the flare (d-e). (f) Post-flare loops accompanying the extensive dimming and intense flare. LOS magnetic-field contours at ±350 G (after heavy smoothing) are overplotted in red and yellow in (b-c, e-f). Bottom: 211/335 Å composites, highlighting the locations of prominent coronal dimming and flaring. Red and blue represent the EUV structural response to different temperatures revealed at 211 and 335 Å, respectively. Movie 2 shows the corresponding BD and composite EUV evolution. The associated movie is available online. |
| In the text | |
|
Fig. 5. Time-slice images showing the successive and failed mass ejections in one event. (a) 171 Å image showing open magnetic field lines dominating the sector “S1–S2” sampling the escaping branch. (b) 193 Å BD image after 22:29 UT subtraction, highlighting successful eruptions along “S1–S2”. The dashed white line traces the eruption-associated wave front. By contrast, “S3–S4” samples the confined branches to explain failed mass ejections. (c) Time-distance plot of 211 Å BD emission (base time 22:29 UT) along “S1–S2”. Piecewise linear fits yield phase speeds that increase from 314 km s−1 to 640 km s−1, then decrease to 259 km s−1. Coronal dimming accompanies the eruption. (d–f) Time-distance evolution of BD emission in 304, 171, and 211 Å along “S3–S4”, respectively. The straight and curved white arrows indicate the failed ejecta falling back toward the Sun. |
| In the text | |
|
Fig. 6. NLFFF extrapolations showing the erupting FR structures (FR1–FR3) corresponding to “ER1–ER3”. The background is the LOS magnetogram saturated at ±350 G (red: positive polarity; blue: negative). FR1–FR3 are rendered in cyan, gray, and green, respectively. The purple contours delineate regions of high free magnetic energy density (95% of the maximum). Panel (b) shows the same topology from an alternative viewing angle. |
| In the text | |
Current usage metrics show cumulative count of Article Views (full-text article views including HTML views, PDF and ePub downloads, according to the available data) and Abstracts Views on Vision4Press platform.
Data correspond to usage on the plateform after 2015. The current usage metrics is available 48-96 hours after online publication and is updated daily on week days.
Initial download of the metrics may take a while.