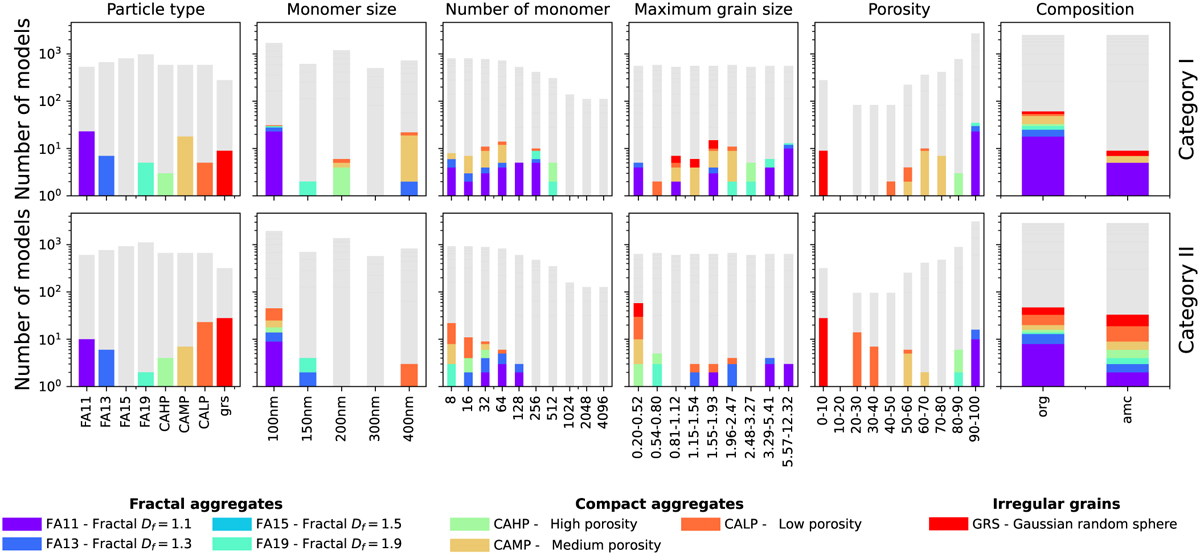
Fig. 7
Download original image
Statistical panel of best models estimated from the Category I (top) and Category II (bottom) SPFs. The colors are linked to the type of particles from AggScatVIR and displayed in the left column. We kept the same colors for the other histogram to track their distribution in monomer size, number of monomers, maximum grain size, porosity, and composition (from left to right). The gray bars represent the total number of all models considered to show the range of possibilities. Note that irregular grains (in red) are not composed of monomers, so they are not visible in the histogram related to aggregates. Furthermore, as they are dense particles, we fixed their porosity to 0.
Current usage metrics show cumulative count of Article Views (full-text article views including HTML views, PDF and ePub downloads, according to the available data) and Abstracts Views on Vision4Press platform.
Data correspond to usage on the plateform after 2015. The current usage metrics is available 48-96 hours after online publication and is updated daily on week days.
Initial download of the metrics may take a while.