Fig. 4
Download original image
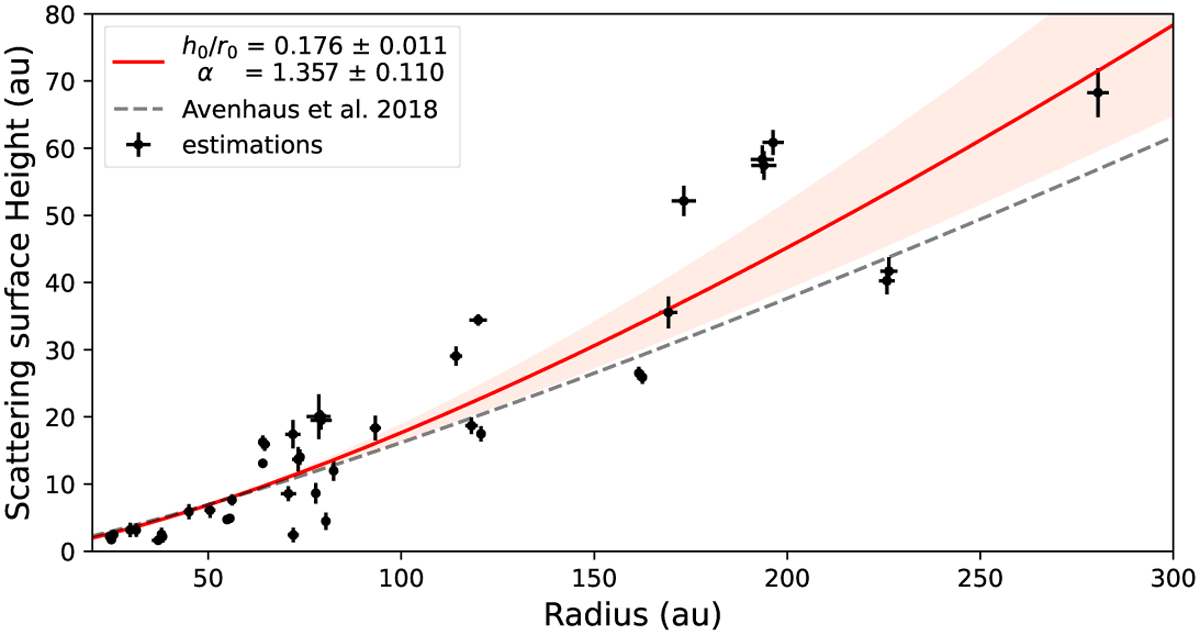
Scattering surface height fitting considering all scattering height estimations. We display fitting in red, and the red zone corresponds to the range of the flaring index at one σα. We display the scattering height estimation from Avenhaus et al. (2018): hs(r) = 16.17 (r/100au)1.219 measured on a different sample as a dashed gray curve for comparison.
Current usage metrics show cumulative count of Article Views (full-text article views including HTML views, PDF and ePub downloads, according to the available data) and Abstracts Views on Vision4Press platform.
Data correspond to usage on the plateform after 2015. The current usage metrics is available 48-96 hours after online publication and is updated daily on week days.
Initial download of the metrics may take a while.