


Fig. 8
Download original image
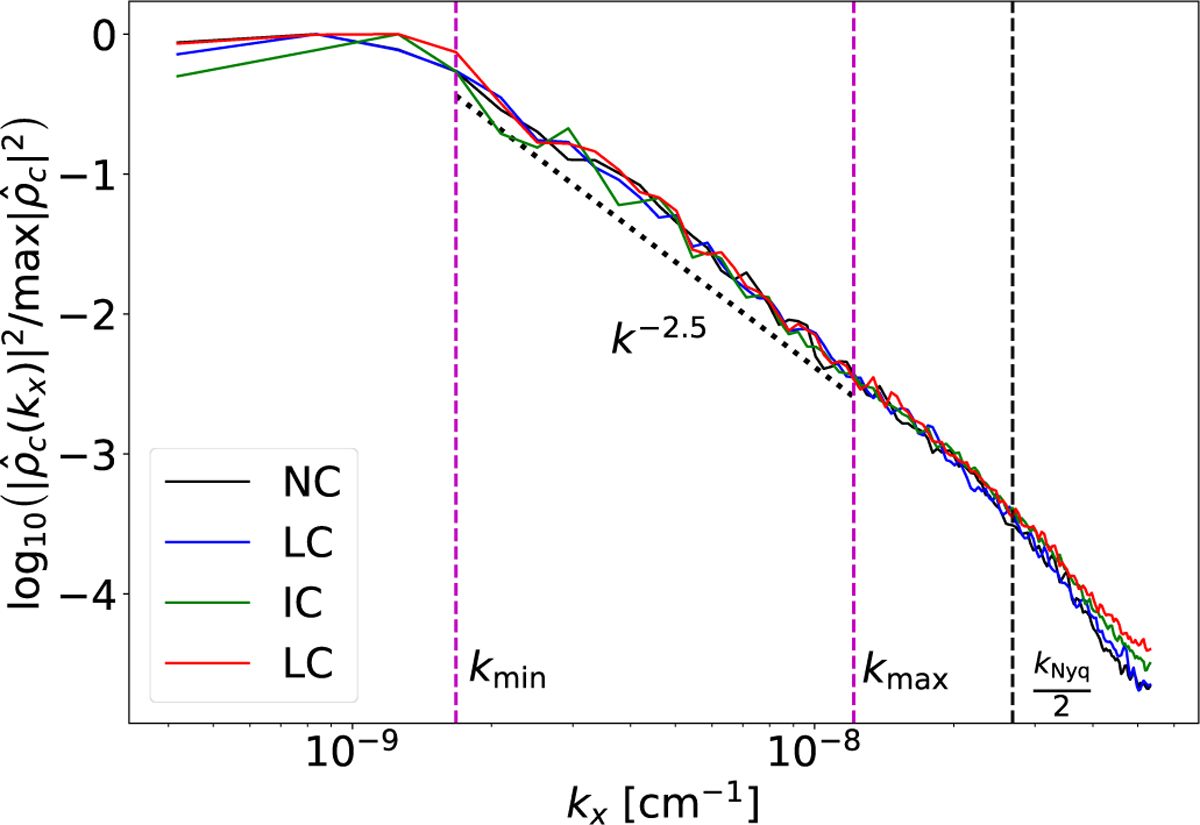
One-dimensional power spectrum of the charge density ρc along the horizontal direction x, computed for the magnetised multiwavelength simulations at an equivalent non-linear stage defined by ∆h/Lx ≃ 0.35. All spectra were obtained using the same spectral procedure and are normalised by their maximum value. The different curves correspond to increasing ion-neutral coupling strength and are labelled NC, LC, IC, and HC (see Sect. 3). The vertical dashed lines indicate the minimum and maximum injected wavenumbers, as well as half the Nyquist limit.
Current usage metrics show cumulative count of Article Views (full-text article views including HTML views, PDF and ePub downloads, according to the available data) and Abstracts Views on Vision4Press platform.
Data correspond to usage on the plateform after 2015. The current usage metrics is available 48-96 hours after online publication and is updated daily on week days.
Initial download of the metrics may take a while.