


Fig. A.1
Download original image
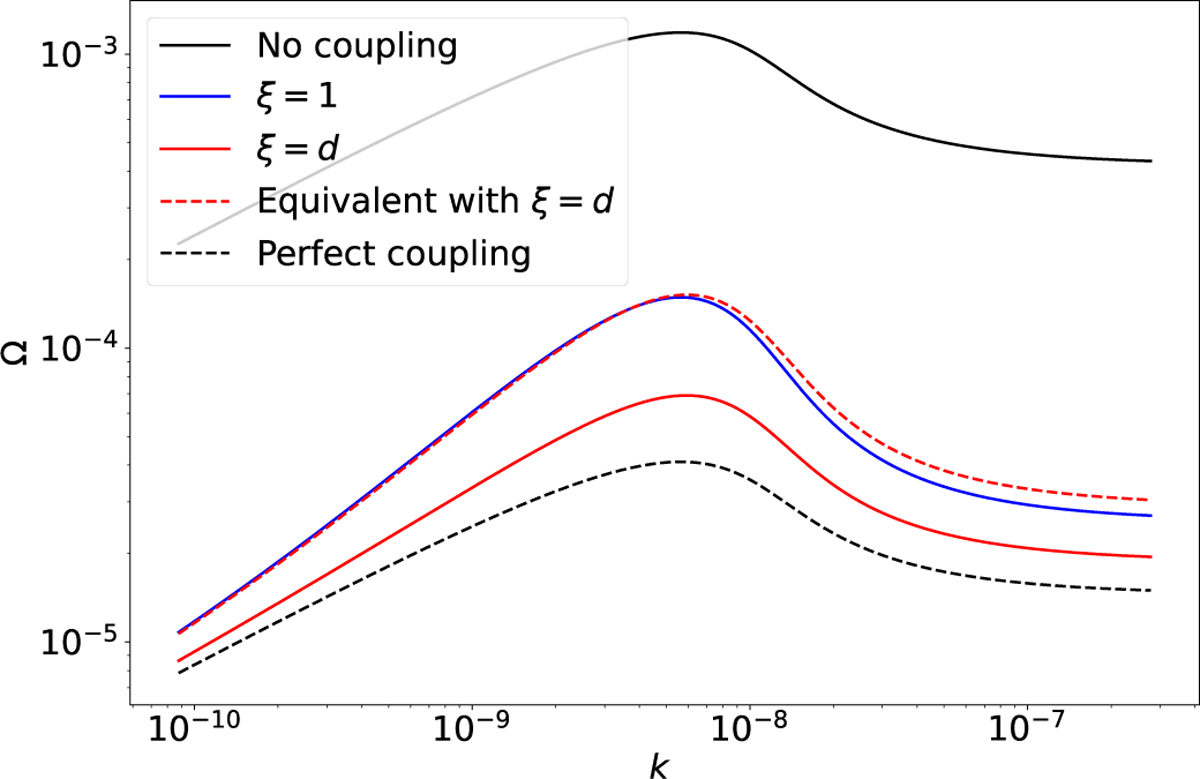
Linear growth rate as a function of the wavenumber k. The black curves show the two asymptotic limits: the uncoupled case (No coupling) and the perfectly coupled case (Perfect coupling). The blue curve corresponds to the formulation with ξ = 1 used in Paper I, while the red curve shows the physically consistent case ξ = d, where the collision frequencies scale with the density contrast across the interface (constant drag coefficient α). The dashed red curve labelled ‘Equivalent with ξ = d’ shows the ξ = 1 formulation evaluated with an effective collision frequency νnc,eq chosen so as to reproduce the ξ = d dispersion curve over the intermediate-k range.
Current usage metrics show cumulative count of Article Views (full-text article views including HTML views, PDF and ePub downloads, according to the available data) and Abstracts Views on Vision4Press platform.
Data correspond to usage on the plateform after 2015. The current usage metrics is available 48-96 hours after online publication and is updated daily on week days.
Initial download of the metrics may take a while.