


Fig. 1.
Download original image
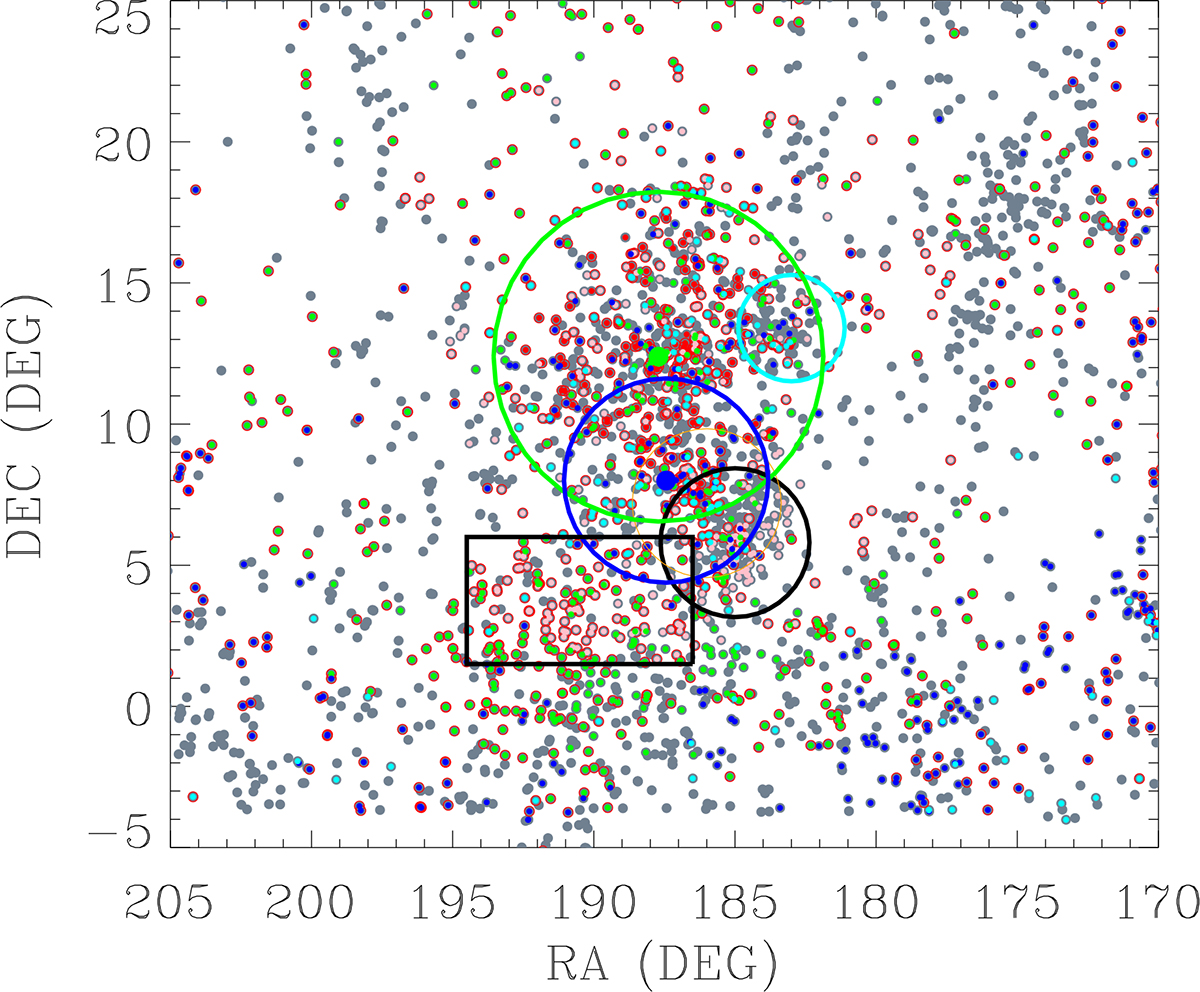
Sky projected positions of galaxies in the Virgo cluster region. The locations of M87 and M49 are shown with large green and blue dots, respectively, whereas the large green, blue, black and cyan circles represent the virial radii of M87, M49, W, and M clouds, respectively (Boselli et al. 2018). The black square indicates the position of the W plume. Colors indicate the 3D cluster-centric distance from M87: r/R200 < 1 (red), 1 < r/R200 < 2 (pink), 2 < r/R200 < 3 (green), 3 < r/R200 < 4 (cyan), and 4 < r/R200 < 5 (blue), while gray points represent galaxies at r/R200 > 5. We note that the figure shows projected sky positions, whereas the color-coding is based on the three-dimensional distance, so galaxies at large distances can appear close to the cluster in projection (see text for further details).
Current usage metrics show cumulative count of Article Views (full-text article views including HTML views, PDF and ePub downloads, according to the available data) and Abstracts Views on Vision4Press platform.
Data correspond to usage on the plateform after 2015. The current usage metrics is available 48-96 hours after online publication and is updated daily on week days.
Initial download of the metrics may take a while.