


Fig. 11
Download original image
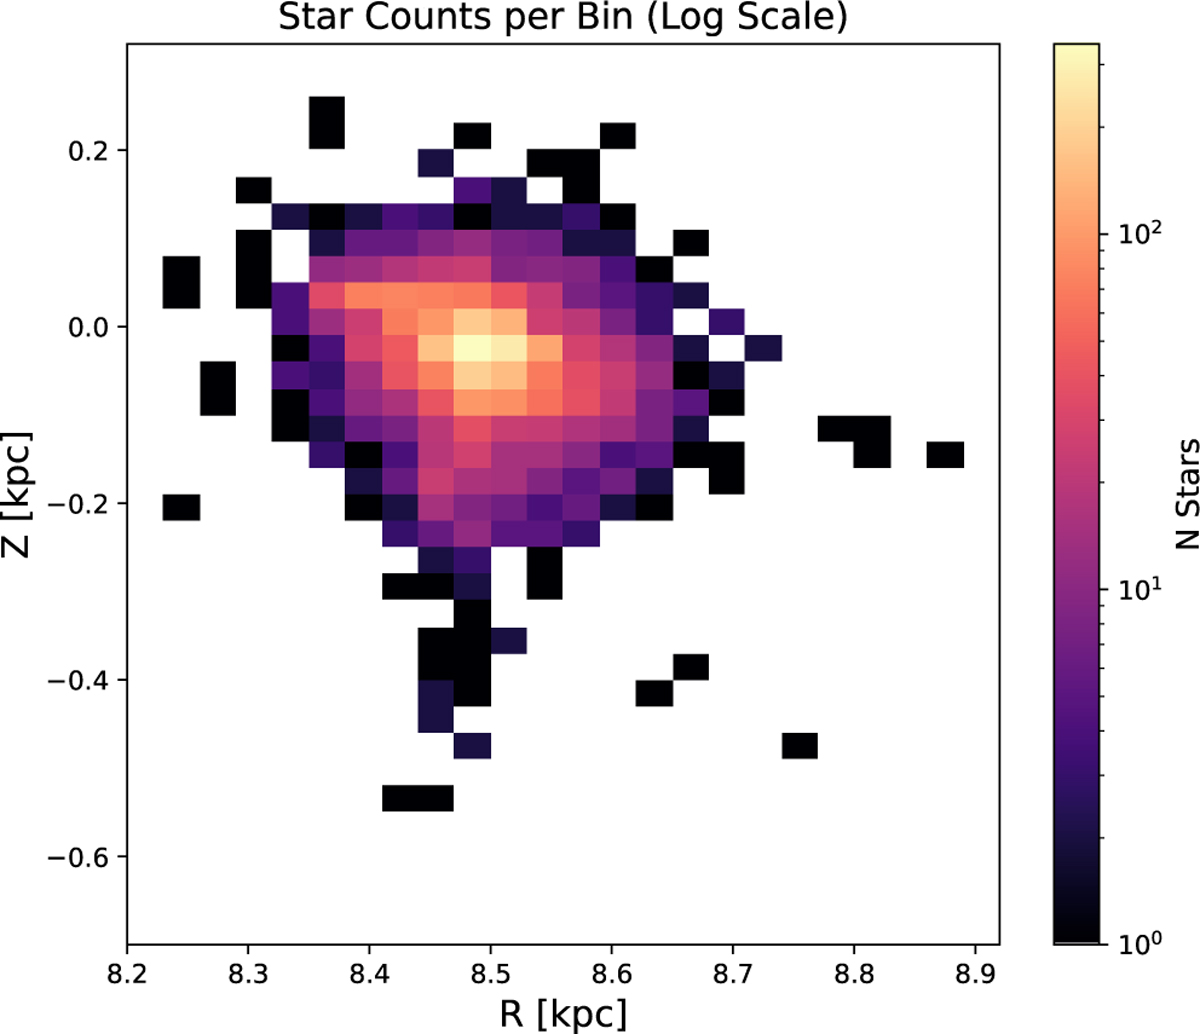
Stellar density distribution in the Galactic plane for the studied sample. The map shows the number of stars per 30 × 30 pc bin on a logarithmic scale. The highest statistical significance is concentrated in the solar neighborhood (R ≈ 8.5 kpc, Z ≈ 0 kpc). Isolated pixels at larger heliocentric distances (low Z) represent low-count bins (N < 10).
Current usage metrics show cumulative count of Article Views (full-text article views including HTML views, PDF and ePub downloads, according to the available data) and Abstracts Views on Vision4Press platform.
Data correspond to usage on the plateform after 2015. The current usage metrics is available 48-96 hours after online publication and is updated daily on week days.
Initial download of the metrics may take a while.