


Fig. 3
Download original image
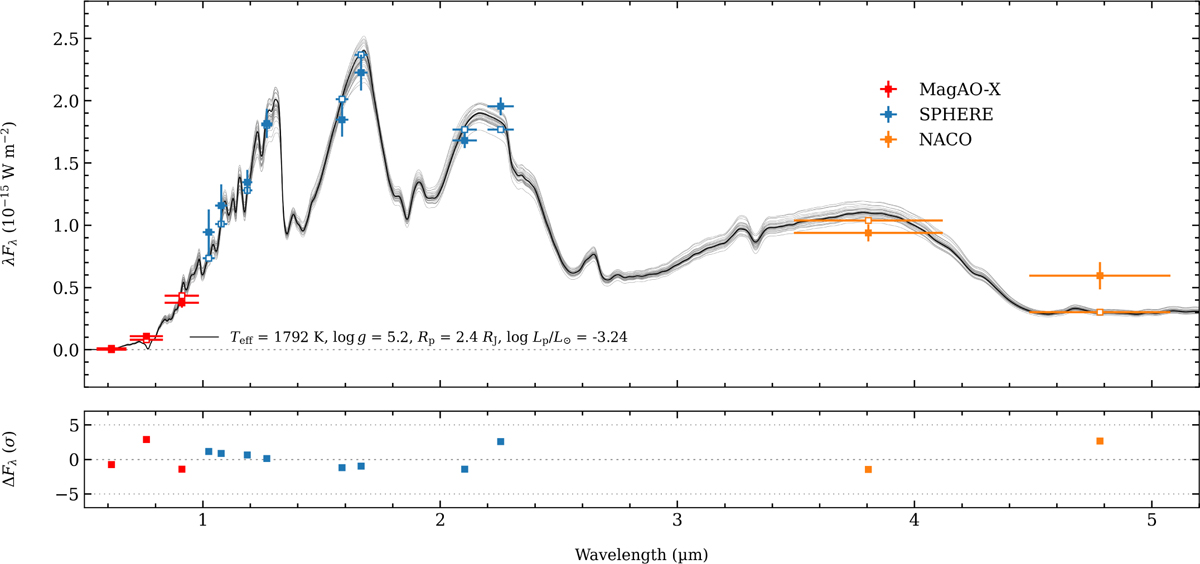
Top: spectral energy distribution (SED) fit of YSES 1 b using MagAO-X, SPHERE, and NACO data using only an atmospheric model. The black line shows the best-fit model (![Mathematical equation: $\[\chi_{\nu}^{2}\]$](/articles/aa/full_html/2026/06/aa59005-26/aa59005-26-eq30.png) = 3.37). The grey lines show 30 random samples drawn from the posterior distribution. The filled markers show the original data points, while the white markers show the synthetic photometry derived from the best-fit model. Bottom: deviation between data and synthetic photometry in units of the standard deviation.
= 3.37). The grey lines show 30 random samples drawn from the posterior distribution. The filled markers show the original data points, while the white markers show the synthetic photometry derived from the best-fit model. Bottom: deviation between data and synthetic photometry in units of the standard deviation.
Current usage metrics show cumulative count of Article Views (full-text article views including HTML views, PDF and ePub downloads, according to the available data) and Abstracts Views on Vision4Press platform.
Data correspond to usage on the plateform after 2015. The current usage metrics is available 48-96 hours after online publication and is updated daily on week days.
Initial download of the metrics may take a while.