


Fig. 9.
Download original image
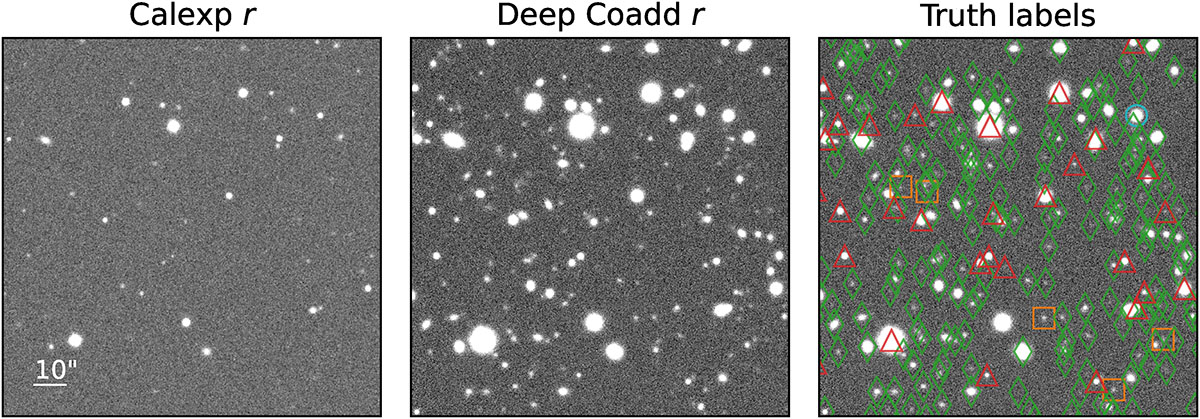
Example single-visit (calexp; left), deep coadd (middle) images, and the underlying truth catalog labels (right). The images correspond to the r-band with a small field of view of 2′ centered around  ,
,  (J2000), while the LSSTCam has a single detector side length of
  . The r-band image corresponds to a stack of N = 289 individual 29.2 s exposures. In the right panel, the colors and symbols mark the positions of Type 1 AGNs (blue circles, one bright source in the top right), Type 2 AGNs (orange squares), galaxies (green diamonds), and stars (red triangles). It is noteworthy that one bright r = 19.05 star is missing its truth label (right panel, bottom-center) due to the contamination of a fainter r = 24.65, z = 1.62 galaxy at a separation of
  .
.
Current usage metrics show cumulative count of Article Views (full-text article views including HTML views, PDF and ePub downloads, according to the available data) and Abstracts Views on Vision4Press platform.
Data correspond to usage on the plateform after 2015. The current usage metrics is available 48-96 hours after online publication and is updated daily on week days.
Initial download of the metrics may take a while.