


Open Access
Fig. 5.
Download original image
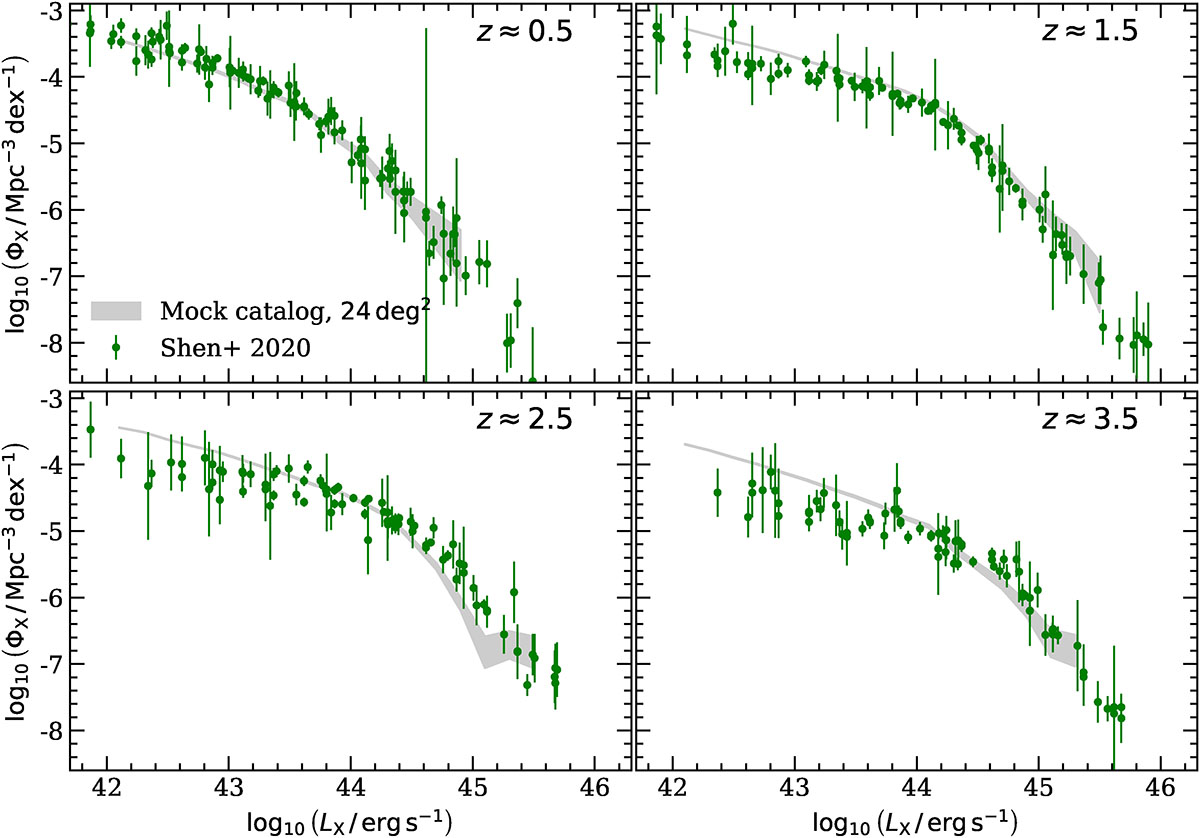
X-ray luminosity function from the mock catalog compared to the literature. The panels correspond to different z values. The shaded region shows the XLF from the 24 deg2 mock catalog, while the green markers show the observed XLF compilation from various surveys (Shen et al. 2020).
Current usage metrics show cumulative count of Article Views (full-text article views including HTML views, PDF and ePub downloads, according to the available data) and Abstracts Views on Vision4Press platform.
Data correspond to usage on the plateform after 2015. The current usage metrics is available 48-96 hours after online publication and is updated daily on week days.
Initial download of the metrics may take a while.