


Fig. 3.
Download original image
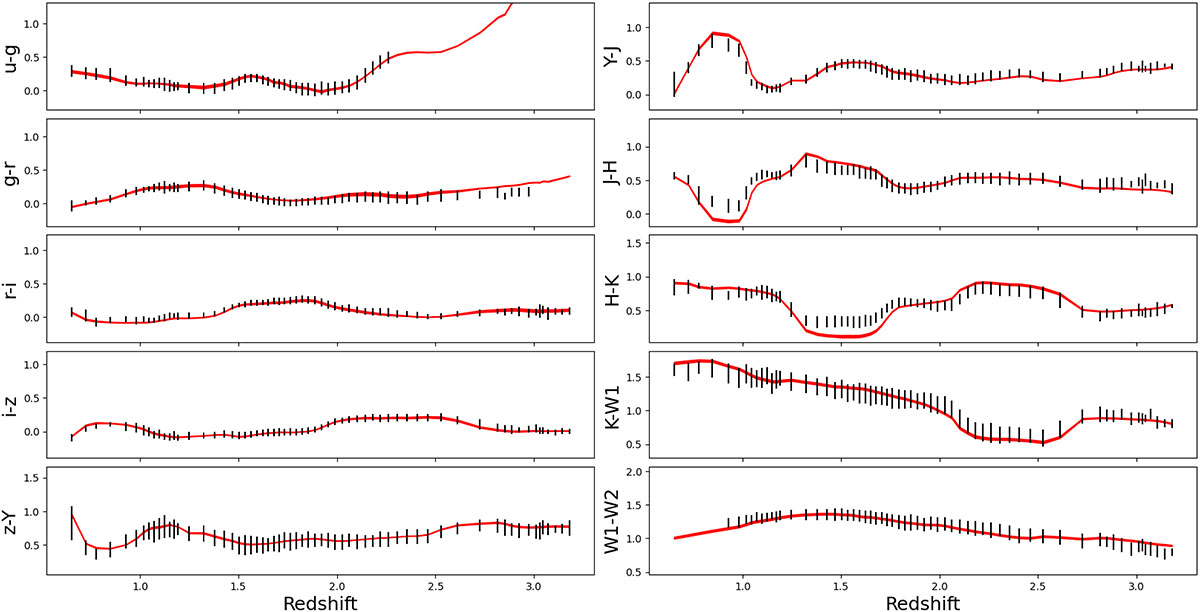
Simulated (red) and observed SDSS DR16 (black; Ahumada et al. 2020) colors versus z. Data and filters are from SDSS-DR16 (ugriz, Lyke et al. 2020), UKIDSS-LAS (YJHK, Lawrence et al. 2012), and unWISE (W1W2, Schlafly et al. 2019). For each z bin, 200 combinations of parameters were drawn from the posterior, the thickness of the line denotes the ±1σ region of the simulated colors.
Current usage metrics show cumulative count of Article Views (full-text article views including HTML views, PDF and ePub downloads, according to the available data) and Abstracts Views on Vision4Press platform.
Data correspond to usage on the plateform after 2015. The current usage metrics is available 48-96 hours after online publication and is updated daily on week days.
Initial download of the metrics may take a while.