


Fig. 2.
Download original image
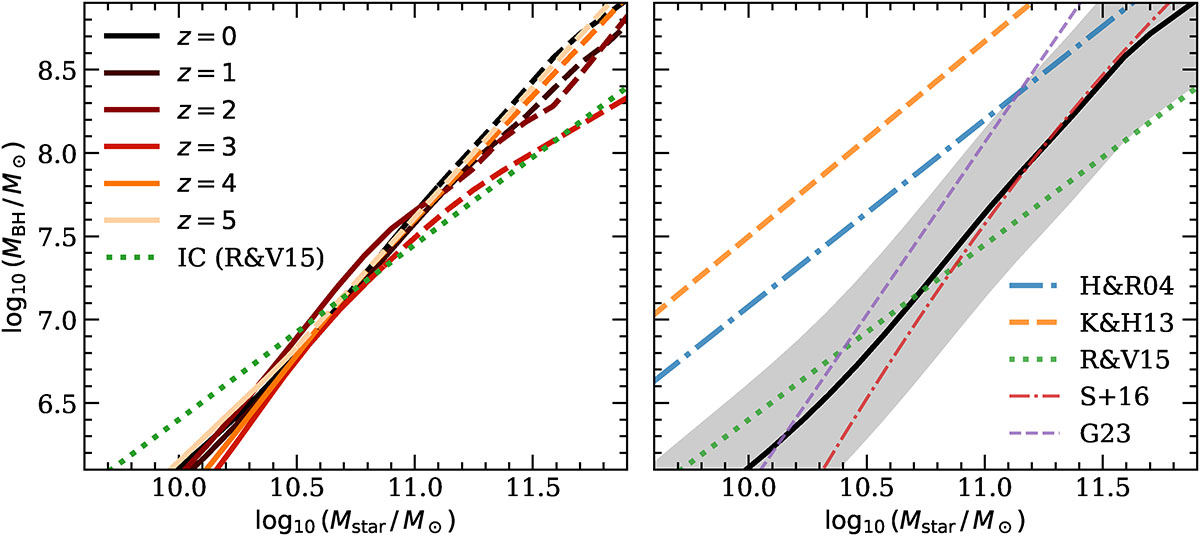
Resulting MBH–Mstar scaling relation from the continuity equation. Left: z evolution of the scaling relations from z = 0 (darker) to z = 5 (lighter). At each redshift, the dashed line style indicates the regime above the 99% stellar mass limits (assuming Weaver et al. 2023 COSMOS2020 stellar mass function and an area of 24 deg2), above which the MBH − Mstar relation is to be considered an extrapolation. The dotted line shows the assumed initial conditions at z = 5.5 (Reines & Volonteri 2015). Right: Local relation implied by the continuity equation (black line). The shaded region corresponds to an assumed scatter of Δlog10(MBH/M⊙) = 0.50 dex. The other non-solid lines correspond to local and inactive early-type galaxies (Häring & Rix 2004; Kormendy & Ho 2013), local AGNs (Reines & Volonteri 2015), the de-biased relation from SDSS galaxies (Shankar et al. 2016), and major-merger built S0 and E galaxies (Graham 2023).
Current usage metrics show cumulative count of Article Views (full-text article views including HTML views, PDF and ePub downloads, according to the available data) and Abstracts Views on Vision4Press platform.
Data correspond to usage on the plateform after 2015. The current usage metrics is available 48-96 hours after online publication and is updated daily on week days.
Initial download of the metrics may take a while.