


Fig. B.1.
Download original image
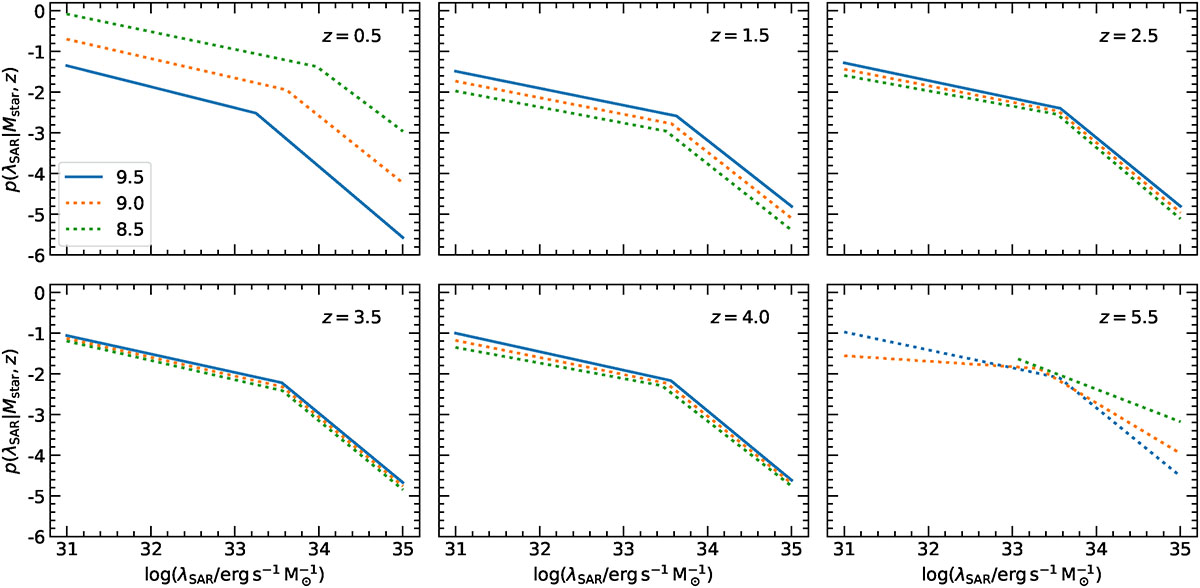
Accuracy of extrapolation in the assumed p(λSAR | Mstar, z, T) (Z24) using the parameter maps. The panels show different z, while the lines correspond to different Mstar as indicated by the legend. Dotted lines indicate extrapolation beyond the formal limits log10(Mstar/M⊙) < 9.5 or z > 4.0 using scipy.interpolate.RegularGridInterpolator. Given the uncertainties of the extrapolation (indicated most clearly in the top-left panel), in this work we choose to extrapolate by using they boundary values log10(Mstar/M⊙) = 9.5 and/or z = 4.0, corresponding to the blue solid curve (where applicable).
Current usage metrics show cumulative count of Article Views (full-text article views including HTML views, PDF and ePub downloads, according to the available data) and Abstracts Views on Vision4Press platform.
Data correspond to usage on the plateform after 2015. The current usage metrics is available 48-96 hours after online publication and is updated daily on week days.
Initial download of the metrics may take a while.