


Fig. 13.
Download original image
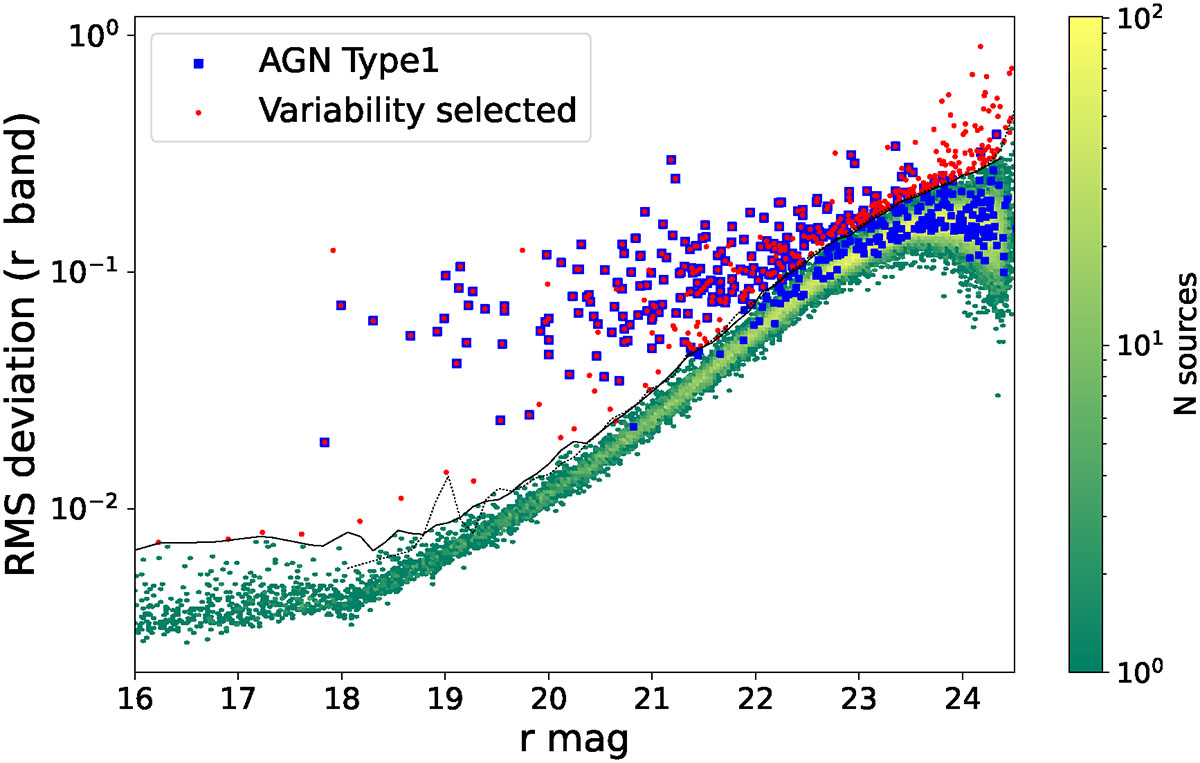
Magnitude versus RMS deviation in the r-band. Sources that are more than three times the MAD above the median of the distribution in a magnitude bin were selected as variable and labeled with red markers. Blue squares indicate Type 1 AGNs. The solid and dotted black lines represent the thresholds used to select variable sources for point-like and extended sources, respectively.
Current usage metrics show cumulative count of Article Views (full-text article views including HTML views, PDF and ePub downloads, according to the available data) and Abstracts Views on Vision4Press platform.
Data correspond to usage on the plateform after 2015. The current usage metrics is available 48-96 hours after online publication and is updated daily on week days.
Initial download of the metrics may take a while.