


Fig. 11.
Download original image
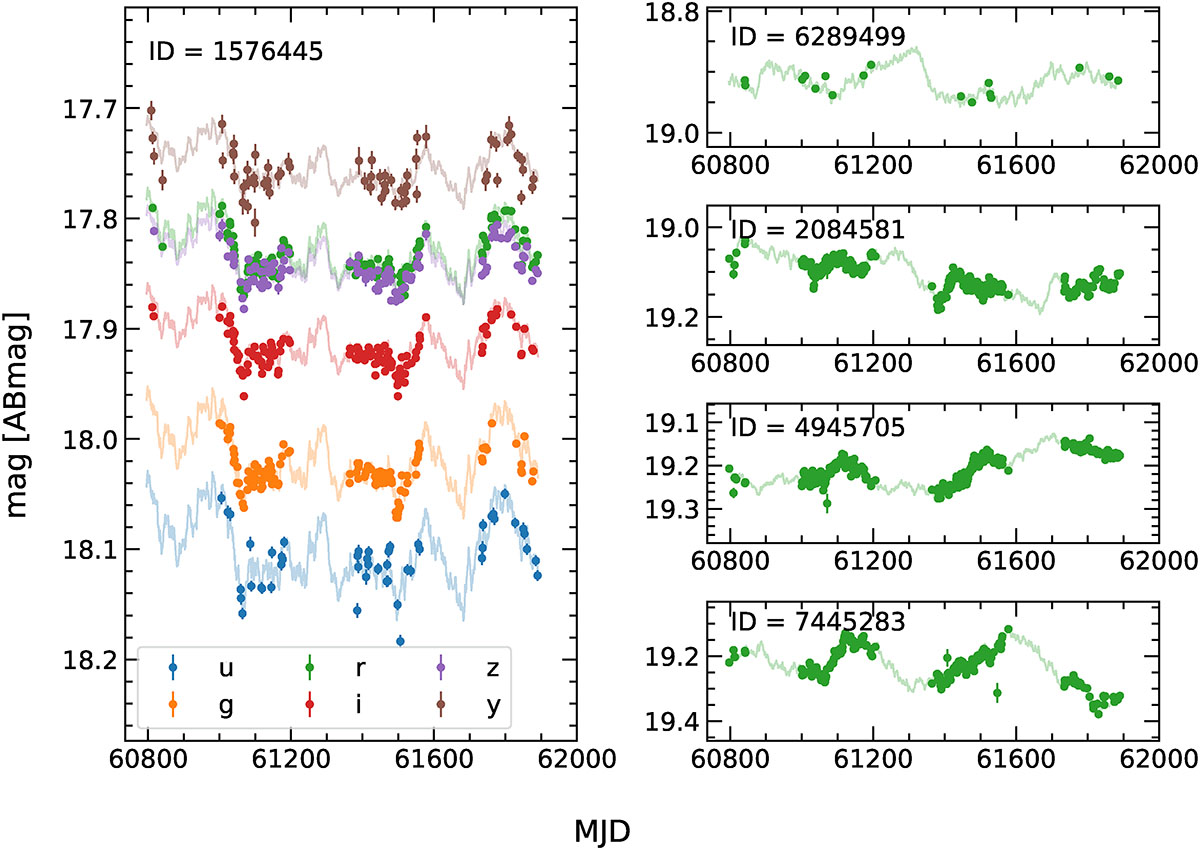
Left: example light curves in the LSST bands of bright AGNs within AGILE DR1. The markers show psfFlux AGN light curves from the forced photometry catalogs, while the lines correspond to the truth catalog light curves in the same bands (indicated by the colors). As explained in the text and Appendix D, only the first exposure of each DDF sequence is shown, and the measured light curves span the first three years of simulated LSST operations in the COSMOS DDF according to baseline v4.0. Right panels: light curves only in the r-band of four bright AGNs. Otherwise, the axes and the units are the same as in the left panel. Top right: AGN (ID = 6289499) located close to the edge (< 1″) of the detector layout (Fig. D.1). It is sampled less frequently compared to the rest.
Current usage metrics show cumulative count of Article Views (full-text article views including HTML views, PDF and ePub downloads, according to the available data) and Abstracts Views on Vision4Press platform.
Data correspond to usage on the plateform after 2015. The current usage metrics is available 48-96 hours after online publication and is updated daily on week days.
Initial download of the metrics may take a while.