


Fig. 10.
Download original image
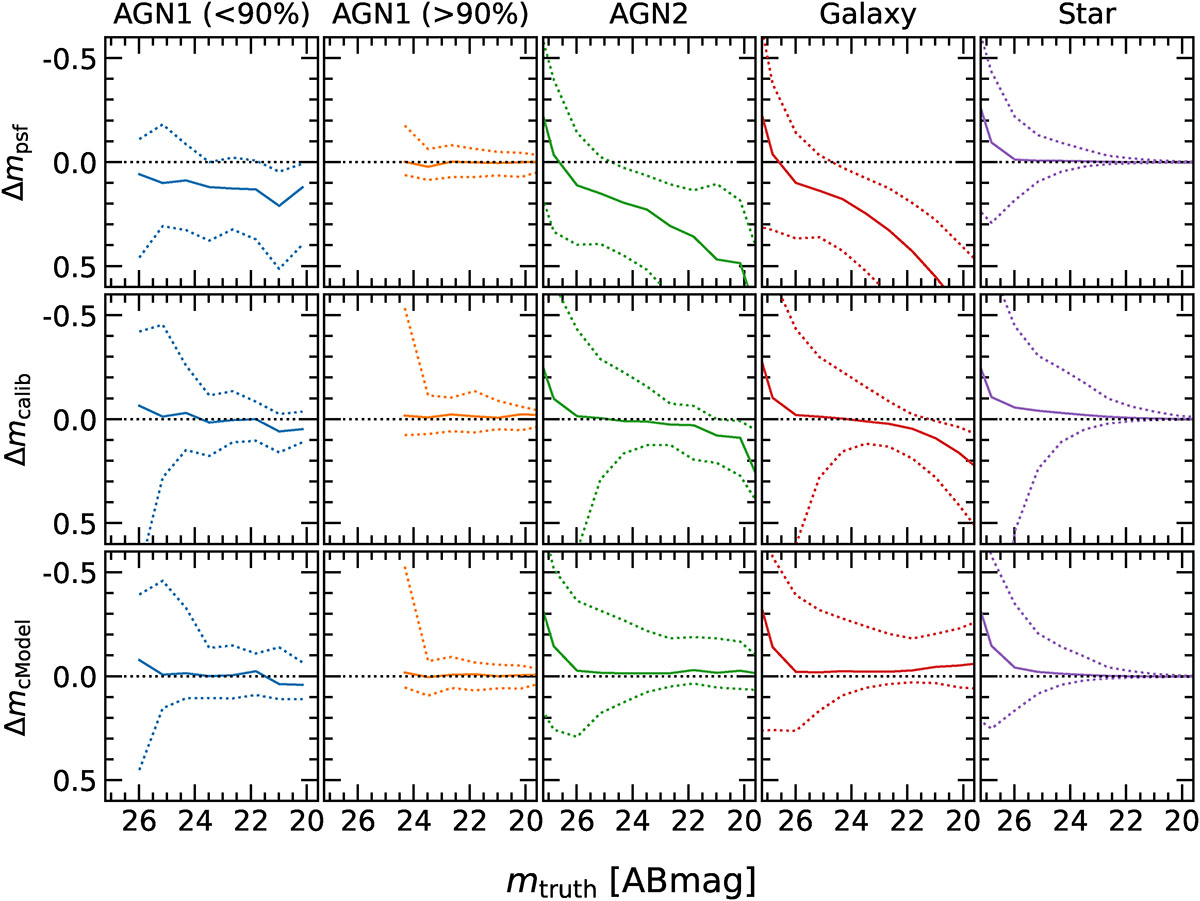
Accuracy of the LSST Science Pipelines flux estimators for different classes of objects. Each panel shows the median (10th and 90th percentile) magnitude difference between the measured flux and the truth flux in the r-band. Rows correspond to the flux estimated using psfFlux, calibFlux (defined as the 12 pixel aperture flux), and cModelFlux, respectively. Columns correspond to the truth labels, as shown at the top of each column.
Current usage metrics show cumulative count of Article Views (full-text article views including HTML views, PDF and ePub downloads, according to the available data) and Abstracts Views on Vision4Press platform.
Data correspond to usage on the plateform after 2015. The current usage metrics is available 48-96 hours after online publication and is updated daily on week days.
Initial download of the metrics may take a while.