


Fig. 4
Download original image
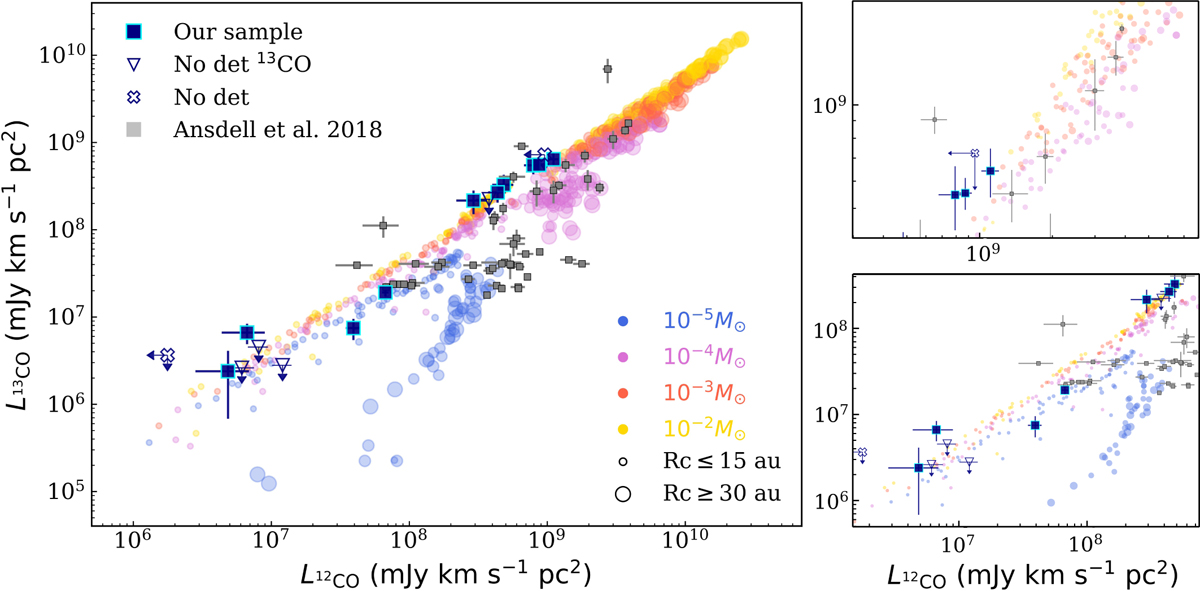
Comparison of Lupus disk CO line luminosities with physical–chemical model predictions. The DALI models from Miotello et al. (2021) are shown as background dots; different colors indicate different disk gas masses, and the symbol size scales with disk radius. The Lupus sources from Ansdell et al. (2018) are overplotted as gray squares. For our sample, blue squares mark detections, open triangles indicate non-detections in 13CO, and open crosses represent non-detections in both CO isotopologs. The two panels on the right show zoomed-in views: the top one show the targets in the first SG, the bottom one the targets of the second SG.
Current usage metrics show cumulative count of Article Views (full-text article views including HTML views, PDF and ePub downloads, according to the available data) and Abstracts Views on Vision4Press platform.
Data correspond to usage on the plateform after 2015. The current usage metrics is available 48-96 hours after online publication and is updated daily on week days.
Initial download of the metrics may take a while.