


Fig. 2
Download original image
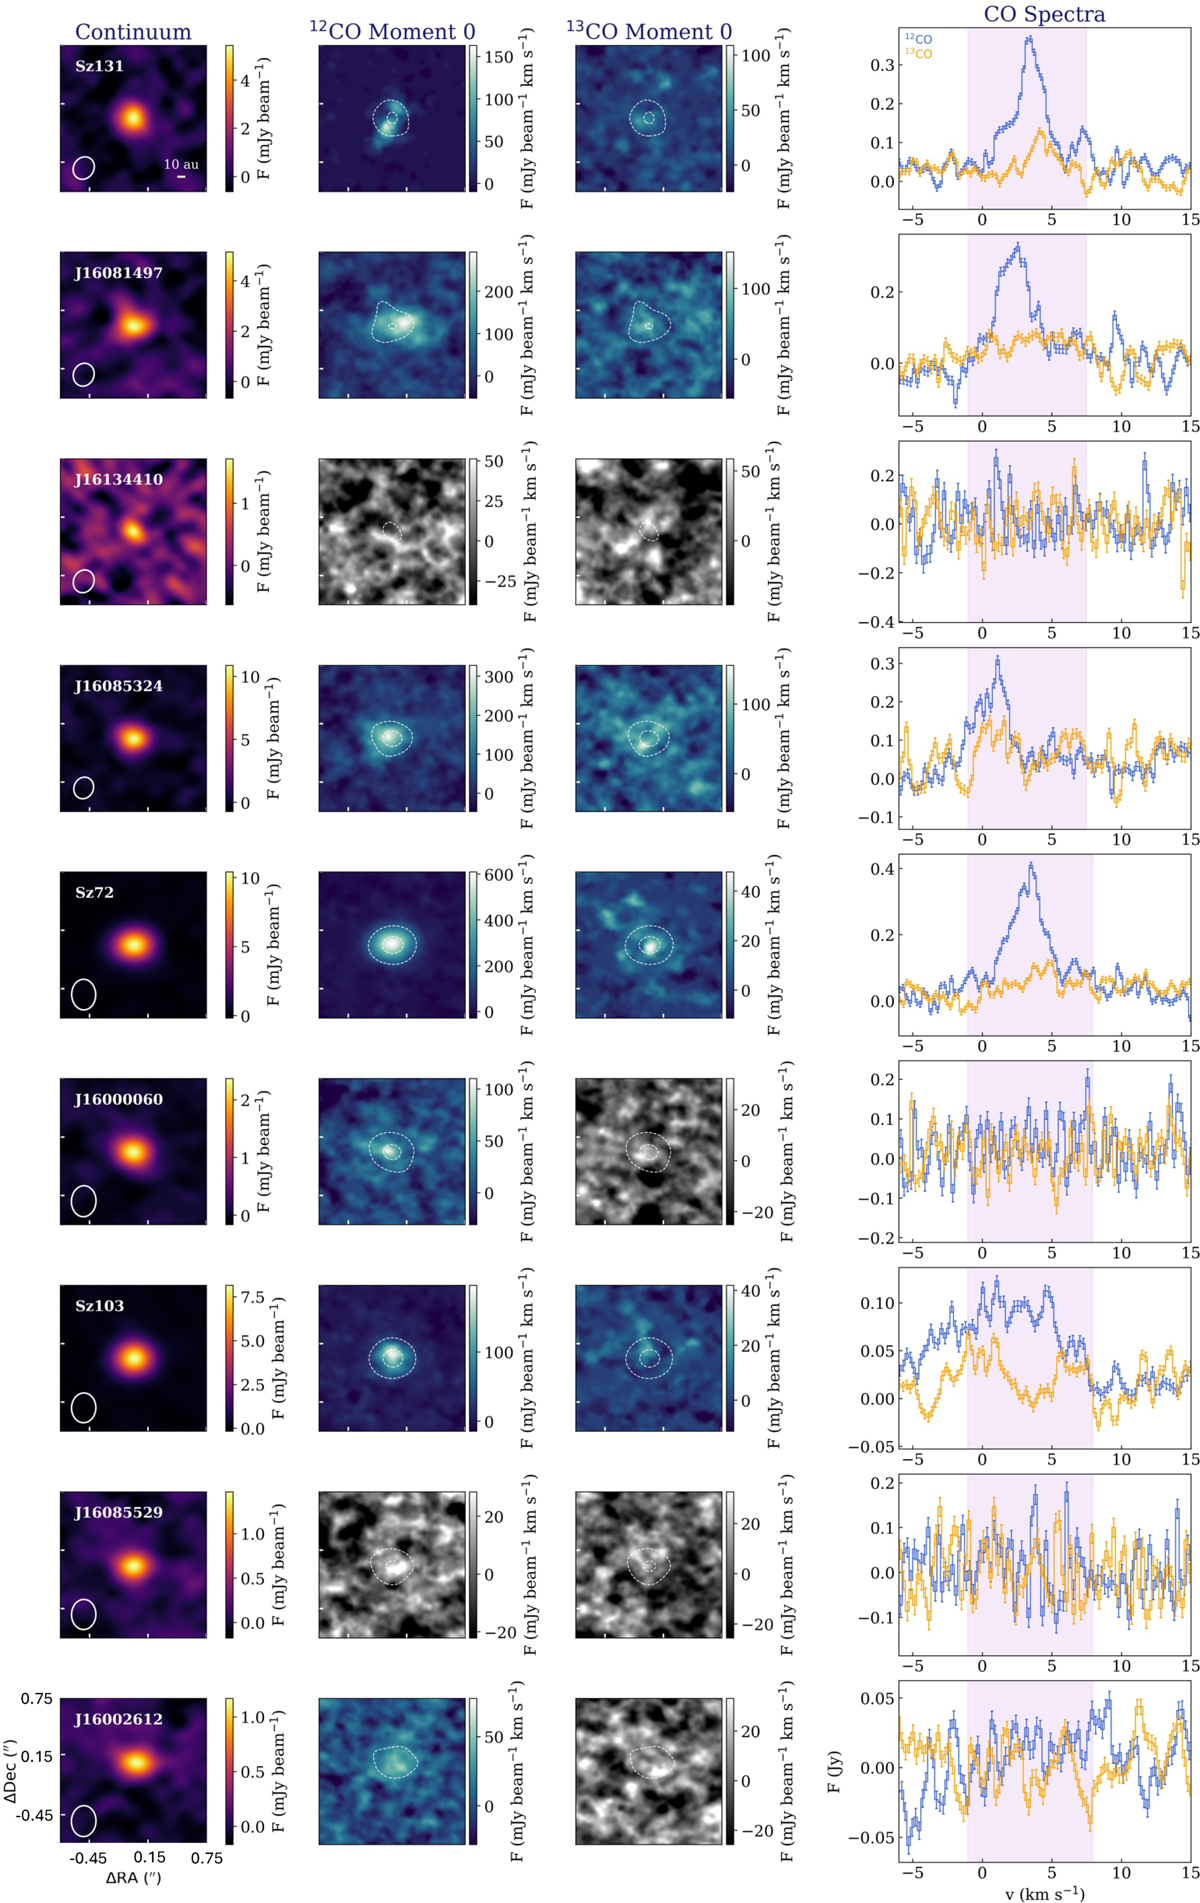
ALMA Band 7 observations of the 17 Lupus disks in our sample. From left to right: continuum, 12CO, and 13CO moment 0 maps, and the integrated spectra for both the molecules. In CO maps, the white contours indicate the continuum emission at the 3 and 10σ levels. Gray panels indicate non detections. In spectra, the shaded region represents the velocity ranges used to create the moment 0 maps. The synthesized beam is shown as a white ellipse in the lower right corner of the continuum images.
Current usage metrics show cumulative count of Article Views (full-text article views including HTML views, PDF and ePub downloads, according to the available data) and Abstracts Views on Vision4Press platform.
Data correspond to usage on the plateform after 2015. The current usage metrics is available 48-96 hours after online publication and is updated daily on week days.
Initial download of the metrics may take a while.