


Fig. 9
Download original image
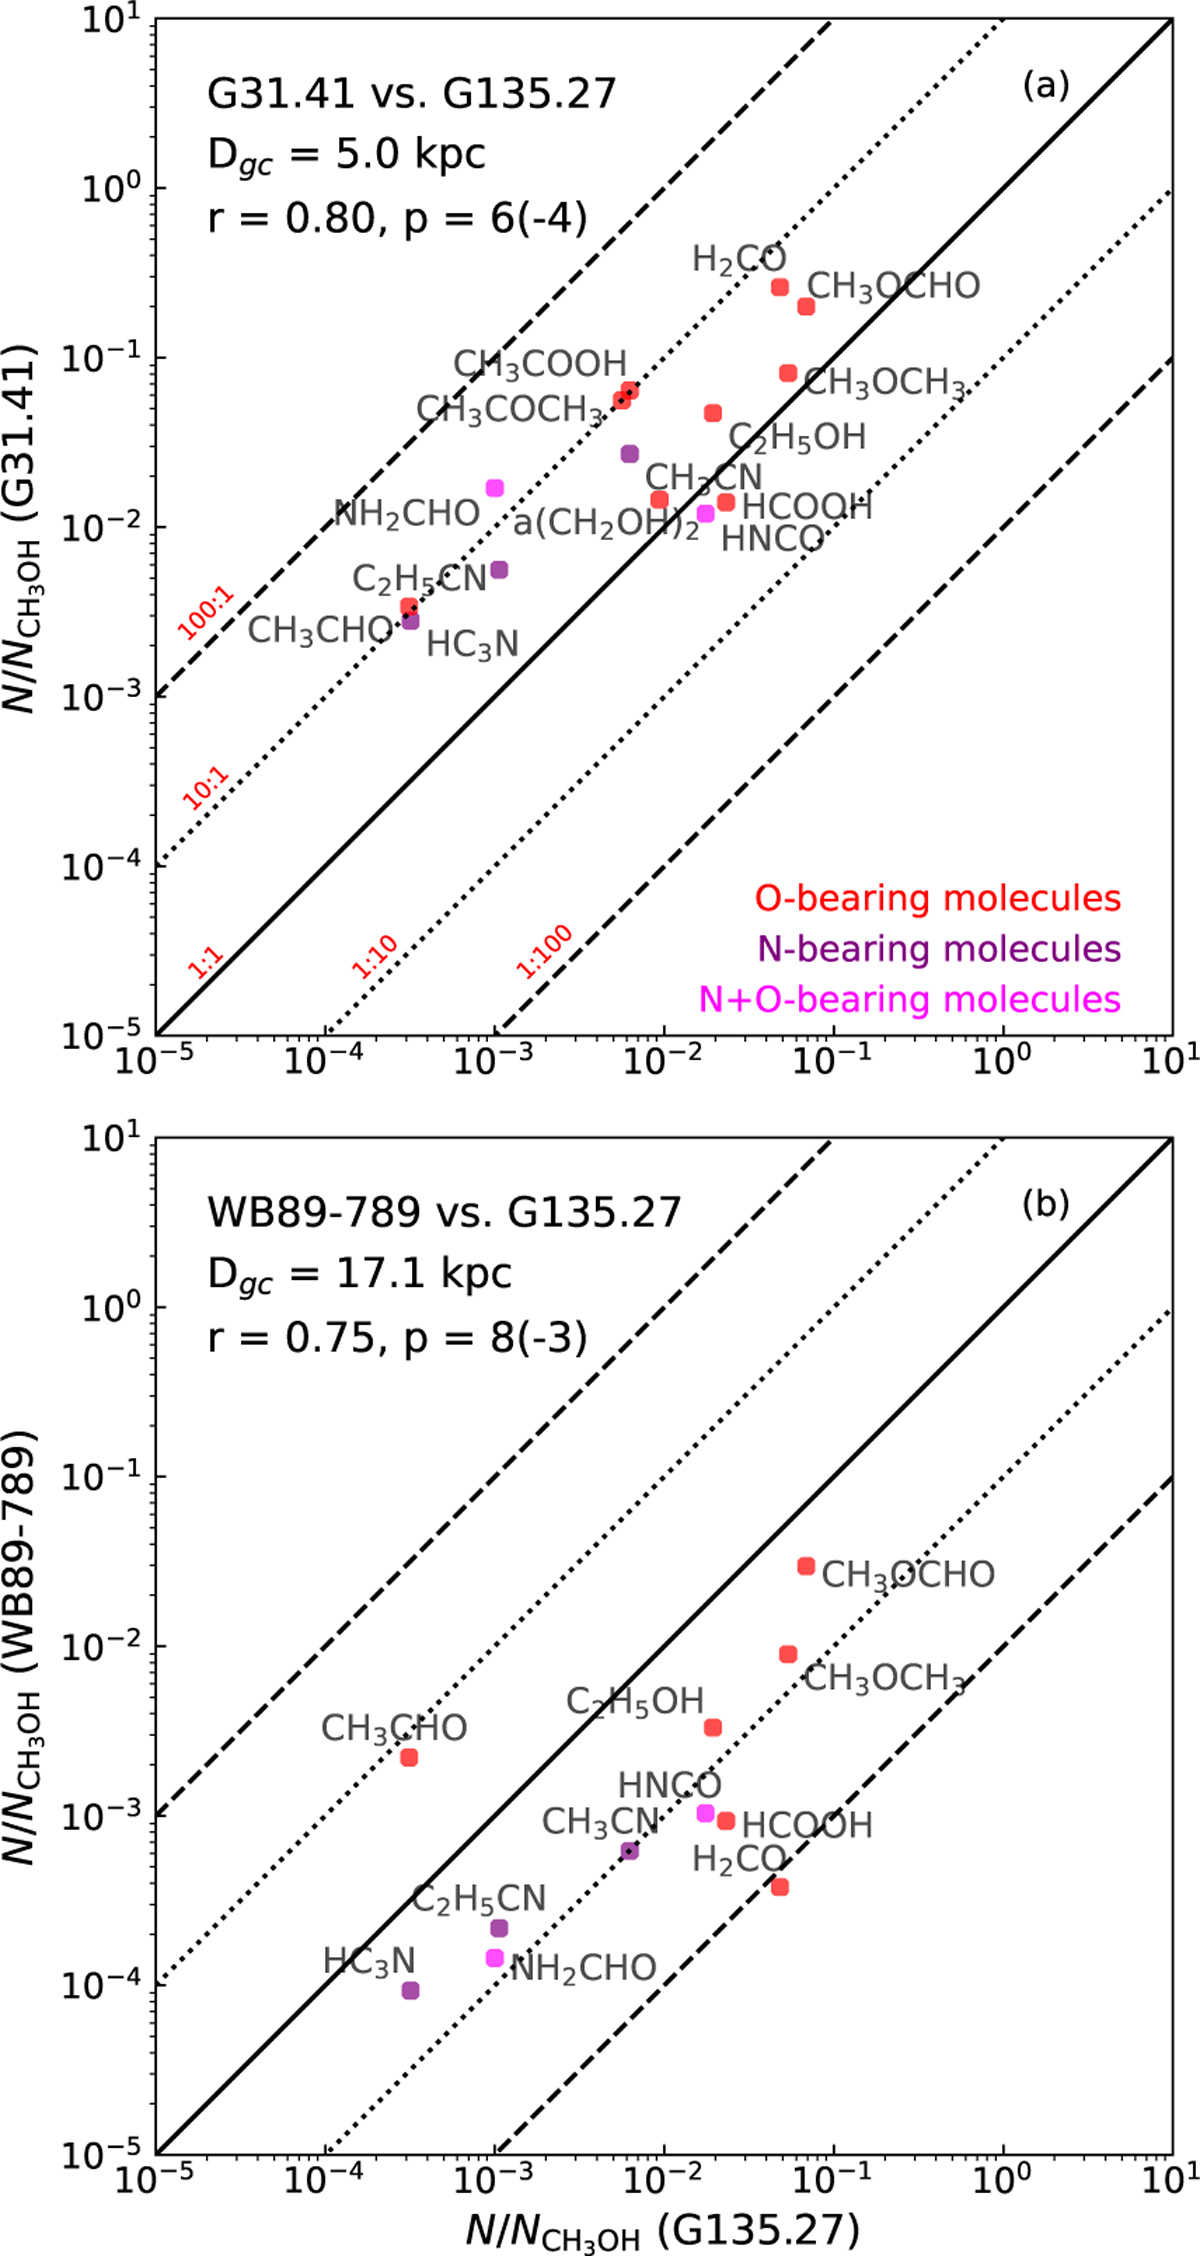
Correlation plots of column densities normalized to methanol in G135.27 MM1 compared to G31.41 (panel a) and WB89-789 (panel b). Oxygen-, nitrogen-, and nitrogen+oxygen-bearing molecules are marked in red, purple, and magenta, respectively. Dashed and dotted lines indicate deviations by factors of 100 and 10, respectively. The Pearson correlation coefficient (r) and P-value for each comparison are shown in the top-left corner of each panel.
Current usage metrics show cumulative count of Article Views (full-text article views including HTML views, PDF and ePub downloads, according to the available data) and Abstracts Views on Vision4Press platform.
Data correspond to usage on the plateform after 2015. The current usage metrics is available 48-96 hours after online publication and is updated daily on week days.
Initial download of the metrics may take a while.