


Fig. 6
Download original image
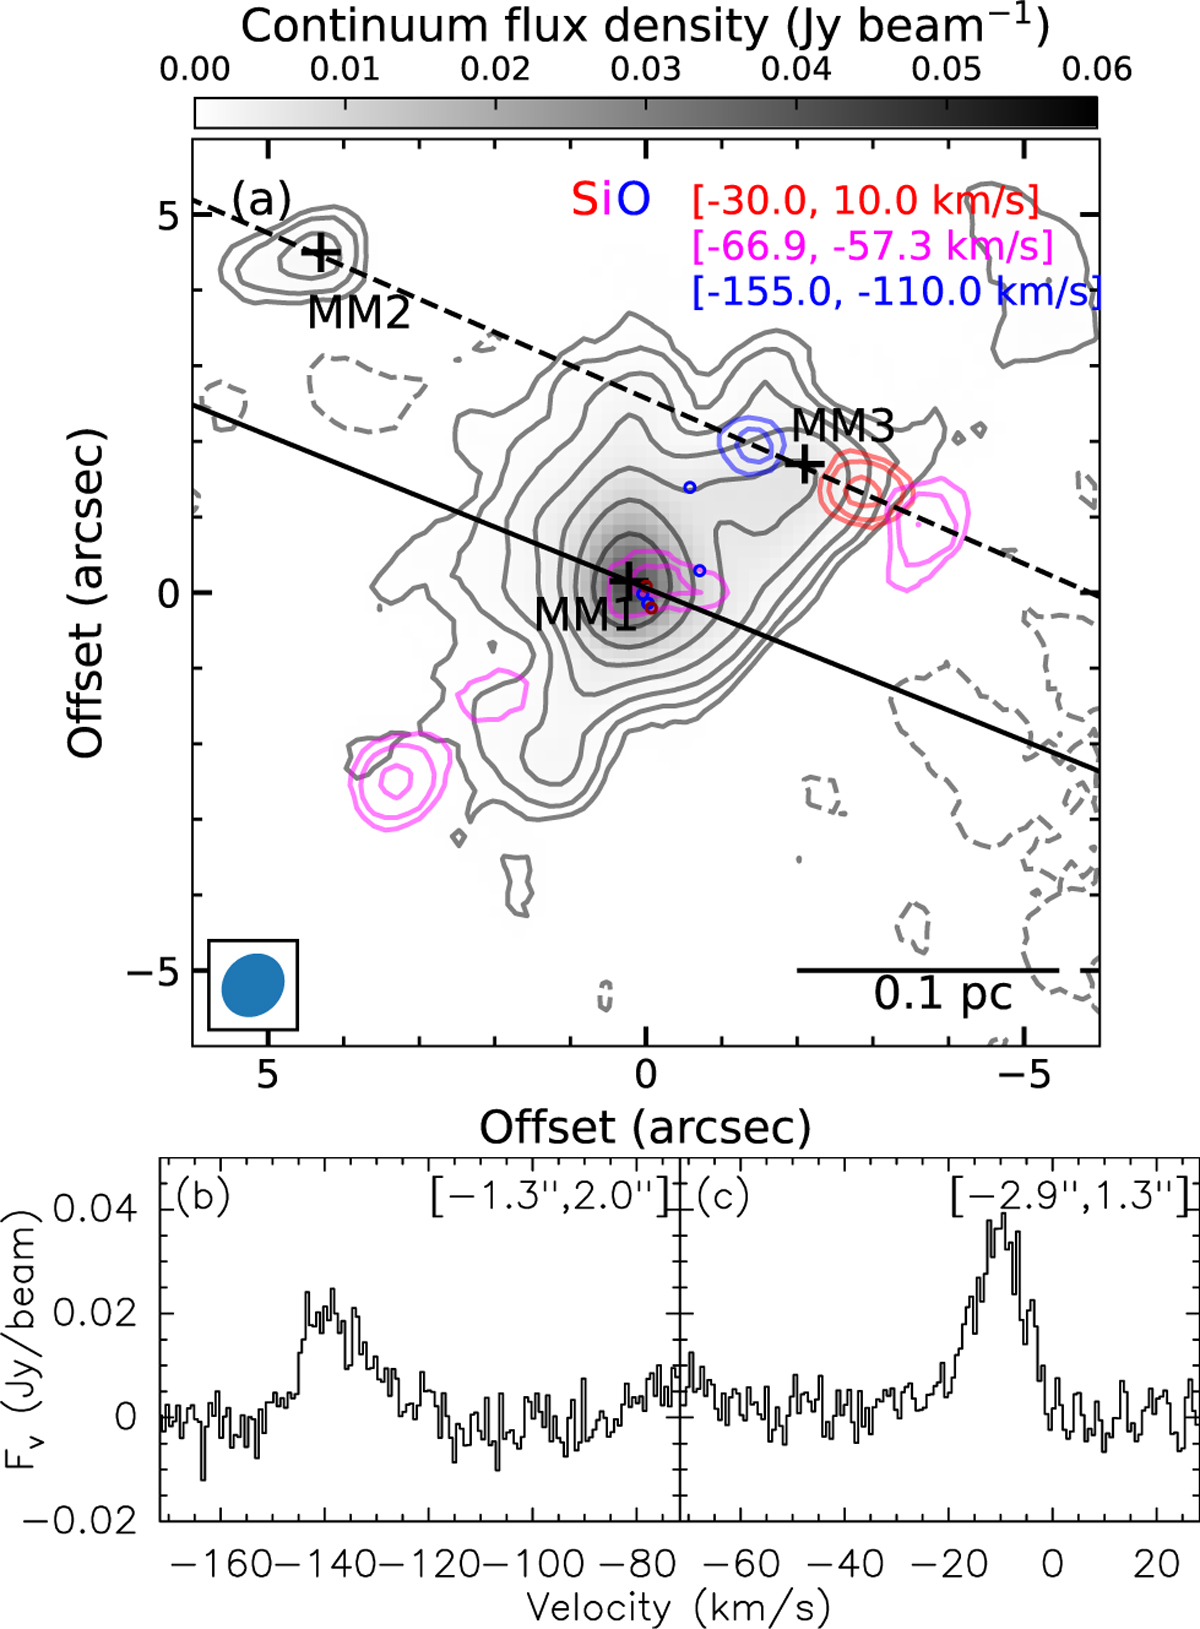
Panel a: extremely high velocity blueshifted (blue contours) and redshifted (red contours) lobes of the outflow associated with MM3 traced by SiO 5–4. The lower-velocity redshifted emission is shown in magenta. The integration range for each component is indicated in the top-right corner. The contours start at 3σ and increase by a factor of two, where σ = 27.5 (red), 13.5 (magenta), and 29.1 (blue) mJy beam−1 km s−1. The black contour levels of the continuum emission and the symbols are the same as in Fig. 1. The solid and dashed lines mark the axes of the outflow associated with MM1 and MM3, respectively. The SiO spectra extracted from the peak positions of the blue- and redshifted emission are shown in panels b and c respectively. The positional offsets relative to the phase center are indicated in the top-right corner of each panel.
Current usage metrics show cumulative count of Article Views (full-text article views including HTML views, PDF and ePub downloads, according to the available data) and Abstracts Views on Vision4Press platform.
Data correspond to usage on the plateform after 2015. The current usage metrics is available 48-96 hours after online publication and is updated daily on week days.
Initial download of the metrics may take a while.