


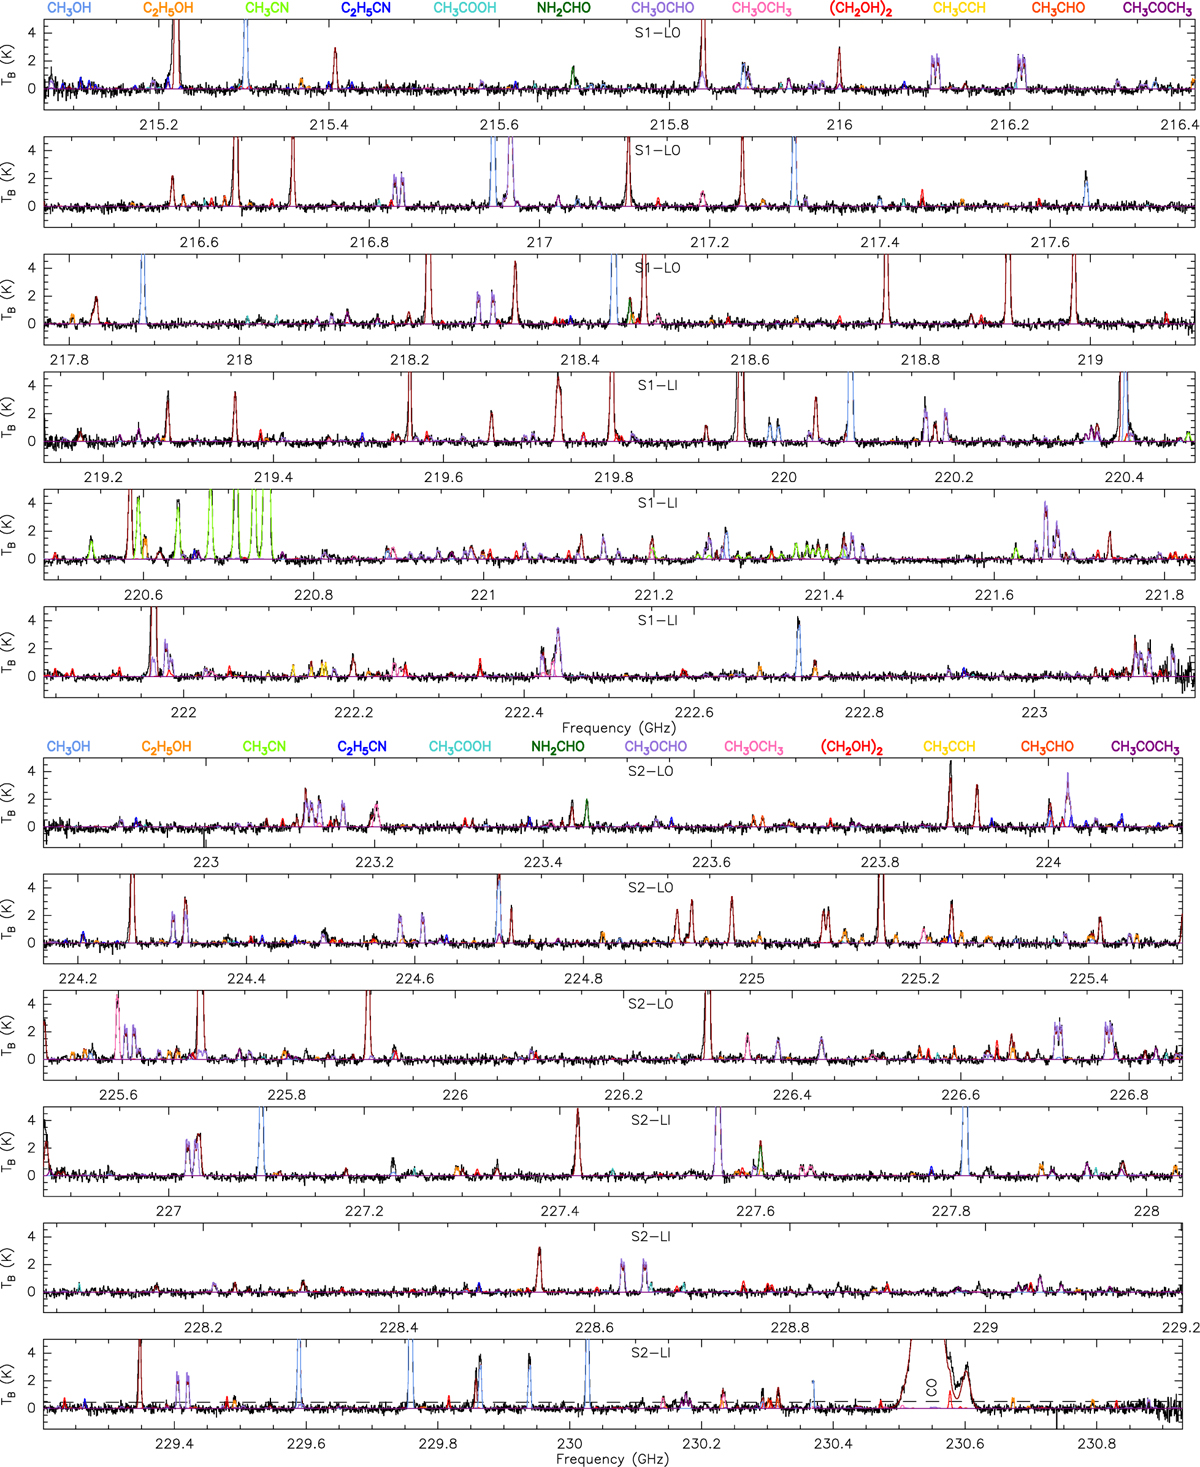
Fig. D.1
Download original image
NOEMA spectrum of the outer Galaxy hot core G135.27 MM1. The observed spectrum and the synthetic spectrum that contains the contribution of all identified molecules are shown in black and dark red, respectively. The synthetic spectra of selected COMs are overlaid in various colors, as labeled at the top. The horizontal dashed line marks the 3σ noise level. The spectra have been truncated to emphasize the faint lines. The synthetic spectrum of S1-UI does not contain the CO contribution because the CO line profile is incomplete in this spectral window.
Current usage metrics show cumulative count of Article Views (full-text article views including HTML views, PDF and ePub downloads, according to the available data) and Abstracts Views on Vision4Press platform.
Data correspond to usage on the plateform after 2015. The current usage metrics is available 48-96 hours after online publication and is updated daily on week days.
Initial download of the metrics may take a while.