


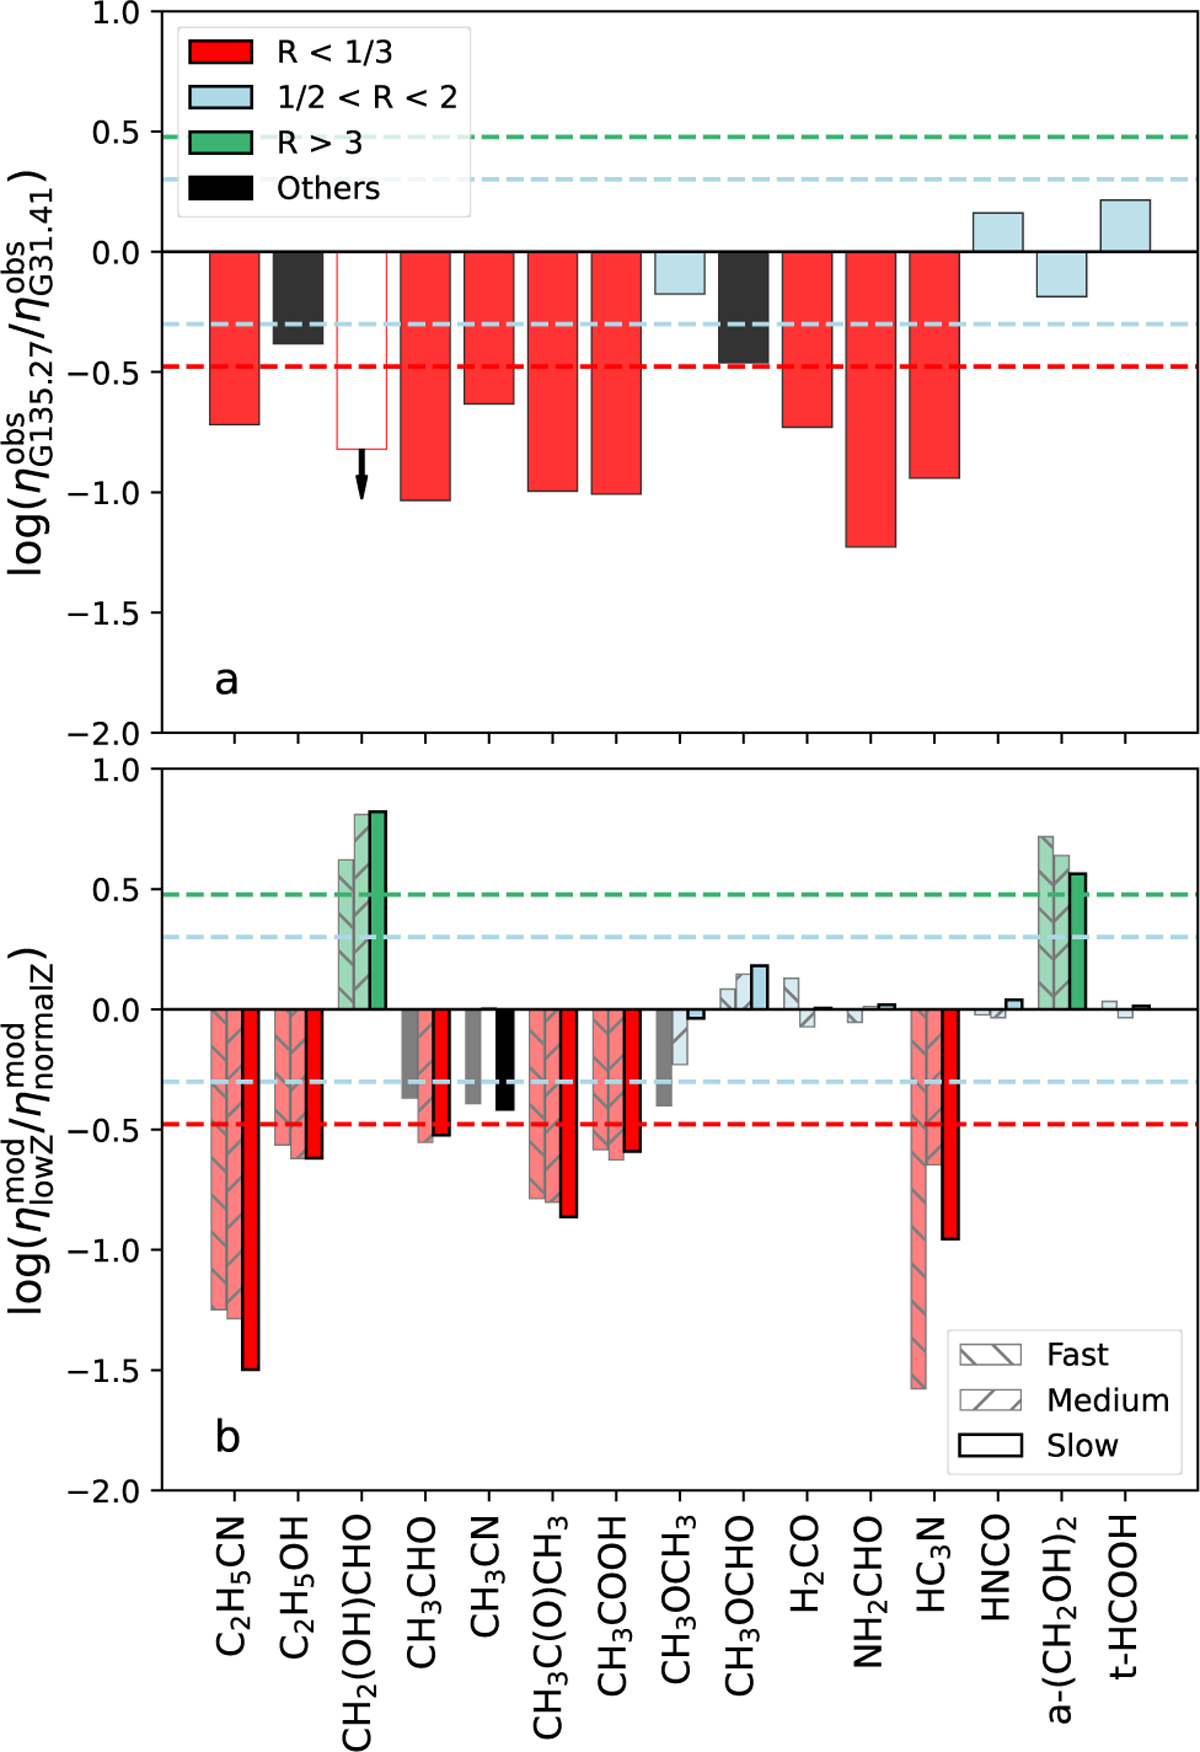
Fig. 14
Download original image
Panel a: observed abundance ratios, R, between G135.27 MM1 and G31.41. Panel b: abundance ratios, R, of models (AV,init = 3 mag) with low and normal metallicity. In both panels, the ratios correspond to η = X/XCH3OH. Molecules with R lower than one-third (dashed red line) or higher than three (dashed green line) are highlighted in red or green, respectively, while those with R within a factor of two of unity (1/2 < R < 2; dashed blue lines) are highlighted in blue. The other molecules are shown in black. The unfilled bar with arrow in panel a represents an observational upper limit for G135.27 MM1. In panel b, the solid bars correspond to the best-fit model of G135.27 MM1 (twu = 1 × 10⁶ yr), while the hatched bars represent the ratios for the other two timescales.
Current usage metrics show cumulative count of Article Views (full-text article views including HTML views, PDF and ePub downloads, according to the available data) and Abstracts Views on Vision4Press platform.
Data correspond to usage on the plateform after 2015. The current usage metrics is available 48-96 hours after online publication and is updated daily on week days.
Initial download of the metrics may take a while.