


Fig. 13
Download original image
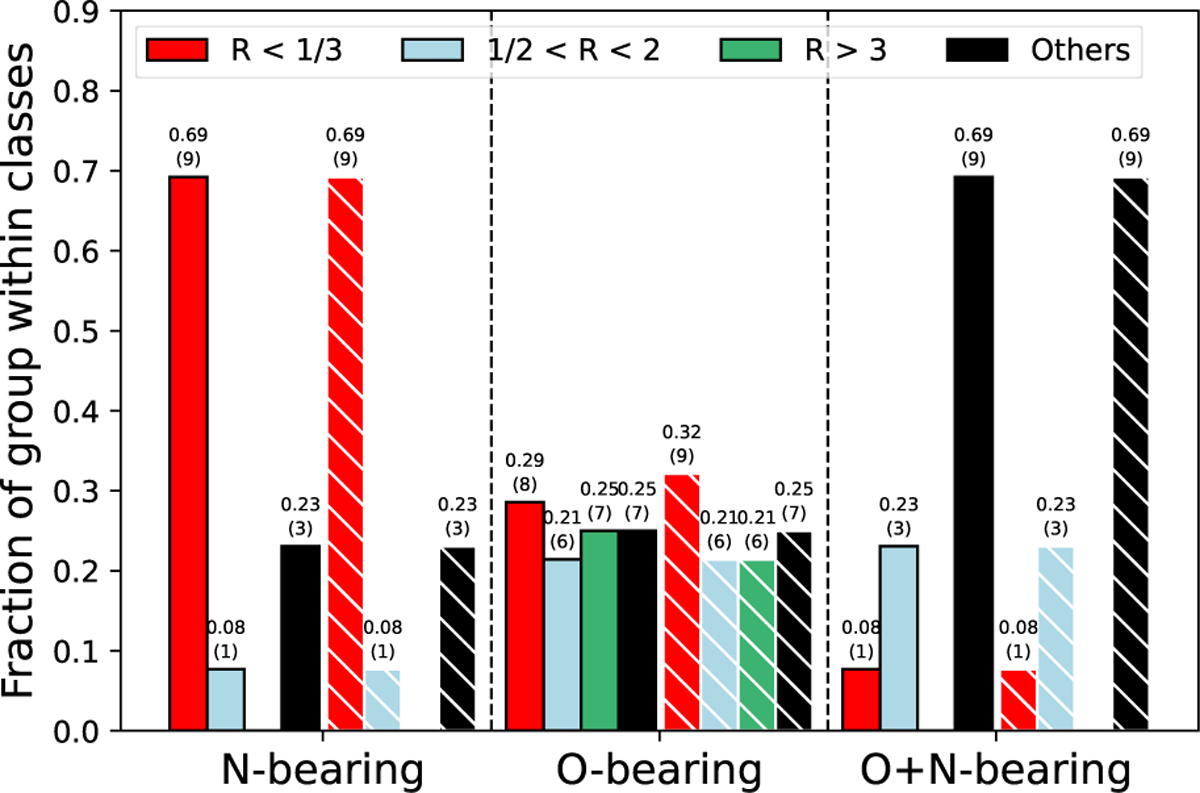
Fraction and number of molecules exhibiting different abundance patterns with respect to metallicity variations for N-, O-, and O+N-bearing COMs, based on chemical modeling results. Their values are shown at the top of each bar. The color coding is the same as in Fig. 11. Solid bars and hatched bars denote the fractions for initial visual extinctions of 2 and 3 mag, respectively.
Current usage metrics show cumulative count of Article Views (full-text article views including HTML views, PDF and ePub downloads, according to the available data) and Abstracts Views on Vision4Press platform.
Data correspond to usage on the plateform after 2015. The current usage metrics is available 48-96 hours after online publication and is updated daily on week days.
Initial download of the metrics may take a while.