


Fig. 12
Download original image
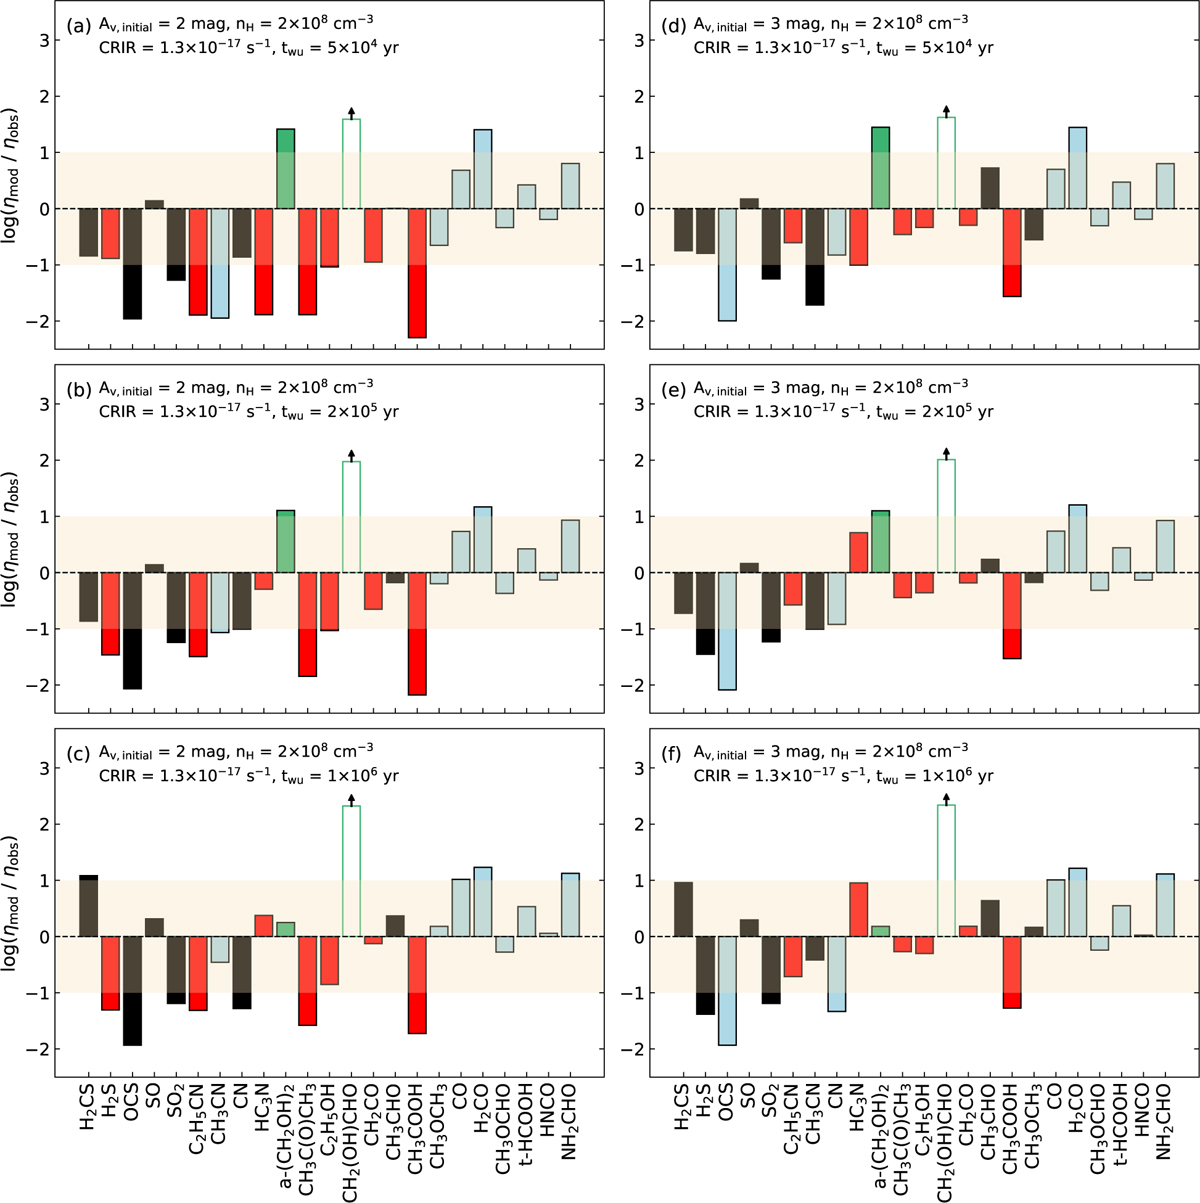
Comparison of the model abundances to observational results for different initial visual extinctions, AV,init = 2 mag (left panels) and 3 mag (rights panels), at varying warm-up timescales: fast (top panels), medium (middle panels), and slow (bottom panels). Bars indicate the number of orders of magnitude by which each modeled abundance ratio exceeds (positive bars) or falls below (negative bars) the corresponding observed ratio. The shaded region denotes agreement within one order of magnitude. Unfilled bars with an arrow represent cases where the comparison is based on an observational upper limit. The color coding is the same as in Fig. 11.
Current usage metrics show cumulative count of Article Views (full-text article views including HTML views, PDF and ePub downloads, according to the available data) and Abstracts Views on Vision4Press platform.
Data correspond to usage on the plateform after 2015. The current usage metrics is available 48-96 hours after online publication and is updated daily on week days.
Initial download of the metrics may take a while.