


Fig. 1
Download original image
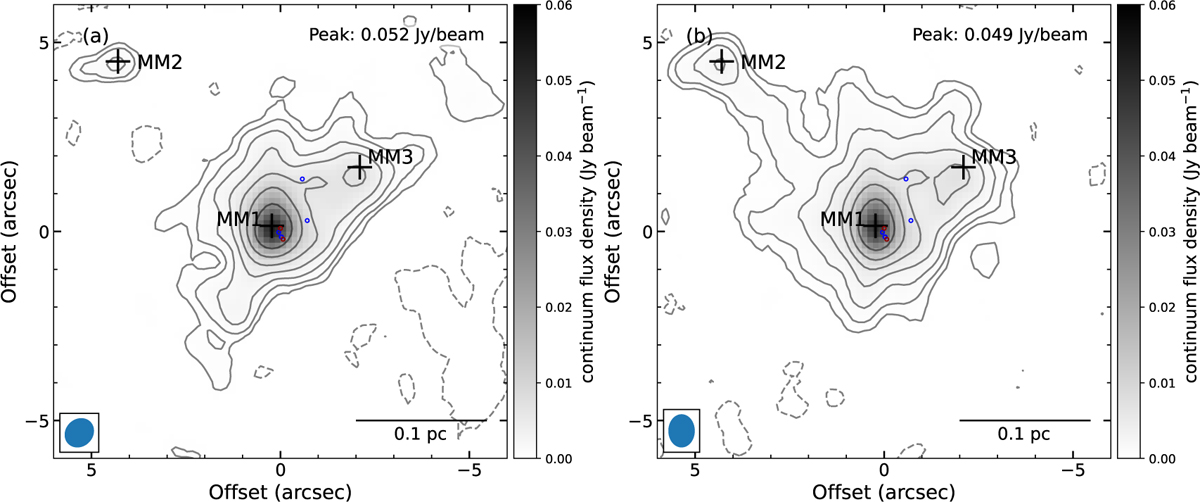
Continuum maps of G135.27 at 233 GHz (a) and 229 GHz (b) in gray scale, extracted from setups S1-UI-CO and S2-LI-CO, respectively. Contour levels start at 3σ and increase by a factor of 2, where σ = 0.13 and 0.12 mJy beam−1, respectively. Negative contours at −3σ are shown as dashed lines. The black crosses mark three continuum peaks of G135.27, labeled MM1, MM2, and MM3 (see Sect. 3.1), with the peak flux density of MM1 indicated in the upper right corner. The empty circles denote the positions of H2O masers (Hachisuka et al. 2009), with blue and red indicating maser spots blue- and redshifted with respect to the source systemic velocity of −71.7 km s−1, respectively (Blair et al. 2008). The beam size (HPBW) is displayed as an ellipse in the bottom left corner. The offsets are defined with respect to the phase center (see Sect. 2.2). The maps are not corrected for primary-beam attenuation.
Current usage metrics show cumulative count of Article Views (full-text article views including HTML views, PDF and ePub downloads, according to the available data) and Abstracts Views on Vision4Press platform.
Data correspond to usage on the plateform after 2015. The current usage metrics is available 48-96 hours after online publication and is updated daily on week days.
Initial download of the metrics may take a while.