


| Issue |
A&A
Volume 710, June 2026
|
|
|---|---|---|
| Article Number | A174 | |
| Number of page(s) | 13 | |
| Section | Stellar structure and evolution | |
| DOI | https://doi.org/10.1051/0004-6361/202556320 | |
| Published online | 16 June 2026 | |
AGILE detection of transient γ-ray emission from the region of the supergiant fast X-ray transient source IGR J17354–3255
1
INAF – Osservatorio di Astrofisica e Scienza dello spazio di Bologna (OAS), Via Piero Gobetti 93/3, 40129, Bologna, Italy
2
INAF – Istituto di Astrofisica e Planetologia Spaziali (IAPS), Via del Fosso del Cavaliere 100, 00133, Roma, Italy
3
Dipartimento di Fisica, Università di Roma Tor Vergata, Via della Ricerca Scientifica 1, I-00133, Roma, Italy
4
INAF – Osservatorio Astronomico di Brera, Via E. Bianchi 46, I-23807, Merate, Italy
5
CISAS G. Colombo University of Padua, Padua, Italy
6
Dipartimento Fisica, Università di Trieste, Via A. Valerio 2, I-34127, Trieste, Italy
7
INFN Sezione di Trieste and Università degli Studi di Trieste, Via Valerio 2, I-34127, Trieste, Italy
8
Università del Salento, Dipartimento di Matematica e Fisica “E. De Giorgi”, Lecce, Italy
9
INFN, Sezione di Lecce, Lecce, Italy
10
Department of Mathematics, University of Pavia, Pavia, Italy
11
ASI Space Science Data Center (SSDC), Via del Politecnico snc, I-00133, Roma, Italy
12
INAF-Osservatorio Astronomico di Roma, Via di Frascati 33, I-00078, Monte Porzio Catone, Italy
13
School of Physics, Wits University, Johannesburg, South Africa
14
INAF – Istituto di Radioastronomia (IRA), I-40129, Bologna, Italy
★ Corresponding author: This email address is being protected from spambots. You need JavaScript enabled to view it.
Received:
8
July
2025
Accepted:
13
April
2026
Abstract
Context. On April 14, 2009, the AGILE satellite detected a γ-ray flare from an unknown transient source. Subsequent X-ray follow-up observations with Swift and INTEGRAL identified the supergiant fast X-ray transient (SFXT) IGR J17354−3255 as the best candidate counterpart, based on positional coincidence and a similar temporal behaviour. Aside from this hint, no SFXT has been firmly detected at high energies to date. Overall, SFXTs comprise a subclass of high-mass X-ray binaries (HMXBs) that host a massive OB supergiant star as a companion donor. They tend to display the most extreme X-ray variability among HMXBs. These systems might be able to emit photons at MeV-TeV energies in the form of fast flares lasting from hours to a few days, with a low-duty cycle.
Aims. In this work, we analyse archival AGILE data to search for γ-ray flares consistent with IGR J17354−3255 and evaluate their possible physical origin.
Methods. We identified a transient source, AGL J1736−3250, which emitted 19 γ-ray flares and was seen to be positionally consistent with IGR J17354−3255. Most flares, detected on a 1 d timescale, concentrate most of their emission on two, four, and six hour timescales, resembling those observed in the X-ray band from IGR J17354−3255.
Results. An orbital phase analysis revealed that approximately half of the γ-ray activity occurs around the apastron passage of the compact object hosted in the binary system. We also incorporated archival Swift and INTEGRAL observations to provide phase-folded light curves at lower energies. Our collected results strongly support a physical association between IGR J17354−3255 and AGL J1736−3250, offering evidence that SFXTs could constitute a new class of Galactic high-energy transient emitters.
Key words: binaries: general / gamma rays: stars / X-rays: binaries
© The Authors 2026
 Open Access article, published by EDP Sciences, under the terms of the Creative Commons Attribution License (https://creativecommons.org/licenses/by/4.0), which permits unrestricted use, distribution, and reproduction in any medium, provided the original work is properly cited.
This article is published in open access under the Subscribe to Open model. This email address is being protected from spambots. You need JavaScript enabled to view it. to support open access publication.
1. Introduction
High-mass X-ray binaries (HMXBs) are binary stellar systems composed of a compact object that is either a neutron star or a black hole, accreting matter from a companion with a mass ≳10 M⊙, typically an O or B star. X-ray emission in most HMXBs is accretion-powered, resulting from the fall of plasma towards the compact object, thereby releasing gravitational potential energy and heating up (e.g. Kretschmar et al. 2019; Fornasini et al. 2023).
Several HMXBs have recently been established as γ-ray emitters, providing evidence of efficient particle acceleration. Some of them are classified as γ-ray binaries, while others are deemed to be γ-ray-emitting X-ray microquasars. The nine gamma-ray binaries that are currently known emit the bulk of their luminosity at energies ≳1 MeV (e.g. Chernyakova et al. 2019; Bordas 2024), in contrast to γ-ray-emitting X-ray microquasars, which peak in the X-ray band. Gamma-ray binaries may either be ‘accretion-powered’ microquasars or ‘rotation-powered’ pulsars. In the latter case, accretion is suppressed by a strong pulsar wind, and γ-rays are produced at the shock interface between the pulsar and companion winds (Dubus 2013; Paredes & Bordas 2019).
Over the past two decades, a new subclass of HMXBs has been discovered, the supergiant fast X-ray transient (SFXTs; for a review see Martínez-Núñez et al. 2017). These systems host a compact object accreting material from a supergiant OB-type star and are characterised by short, sporadic X-ray outbursts lasting from a few hours to a few days. Initially, SFXTs were discovered by INTEGRAL (Sguera et al. 2005, 2006; Negueruela et al. 2006). Today they represent the most extreme case of X-ray variability among HMXBs, exhibiting: (1) flaring X-ray activity on timescales from a few minutes to a few hours; (2) very low duty cycles (0.1 − 5% above 20 KeV); and (3) dynamic ranges (of flux variations) up to five or six orders of magnitude below 10 keV (Romano et al. 2015; Sidoli et al. 2023). Approximately ten SFXTs are currently known and the number of candidates is approximately on the same level. These sources display X-ray luminosities of LX ∼ 1033 − 34 erg s−1 in low-luminosity states and LX ∼ 1036 − 37 erg s−1 during flares, although quiescent luminosities of LX ∼ 1031 erg s−1 and flares reaching LX ∼ 1038 erg s−1 have occasionally been observed. Some SFXTs show X-ray pulsations and spectral properties similar to other accreting pulsars in HMXBs; namely, an absorbed, flat power law below 10 KeV (photon index between 0 and 1), with a high-energy cut-off at ≈10 − 30 keV. The physical mechanisms driving this peculiar phenomenology remain unclear and have been debated at length in the literature (for a recent review see Kretschmar et al. 2019).
An open question regarding SFXTs is whether they have the capacity to emit γ-rays in the range from MeV to TeV energies (Sguera et al. 2009; Li & Zhang 2011; Sguera 2013; Abe et al. 2025). As in the case of γ-ray binaries and γ-ray-emitting X-ray microquasars, SFXTs might also produce high-energy (HE ∼ MeV–GeV range) and very-high-energy (VHE ∼ TeV range) emission, as these systems contain the same components; namely, a compact object and a massive early-type companion star. However, detecting such emission is a non-trivial task for current HE and VHE instruments, as it likely consists of unpredictable flares with short duration, small duty cycles, and relatively low flux. To date, several circumstantial pieces of evidence have suggested that SFXTs might be the counterparts to unidentified transient HE and VHE sources (Sguera 2009; Sguera et al. 2011). Among these, IGR J17354−3255 stands out as one of the most promising cases.
IGR J17354−3255 is a transient hard X-ray object discovered by INTEGRAL (Winkler et al. 2003) in 2006, in the framework of the Galactic Bulge monitoring program, during an outburst with a 20 − 60 keV flux of ∼20 ⋅ 10−10 erg s−1 cm−2 (Kuulkers et al. 2006, 2007). A comprehensive hard X-ray study performed with INTEGRAL in the 18 − 60 keV energy band characterised IGR J17354−3255 as a weak, persistent, hard X-ray source spending most of its time in an out-of-outburst state with an average flux of ∼1.4 ⋅ 10−11 erg s−1 cm−2. The source occasionally exhibits X-ray flares lasting from a few hours to a few days, with a dynamic range of 20 − 200 above 20 KeV (Sguera et al. 2011). Since IGR J17354−3255 is not reported in the second INTEGRAL/IBIS catalogue (Bird et al. 2006), despite an effective on-source exposure of 1.5 Ms, the dynamic range above 20 KeV can be increased to > 900. XMM-Newton observations further increased the dynamic range to > 2500 in the 0.5 − 10 keV band (Bozzo et al. 2012). These X-ray properties supported the classification of IGR J17354−3255 as an intermediate SFXT, a subclass characterised by dynamic ranges and average luminosities between that of classical SFXTs and persistent supergiant HMXBs. Chandra observations improved the source localisation (Tomsick et al. 2009), enabling the spectroscopic identification of the optical/infrared counterpart1 as a O9 supergiant (Coleiro et al. 2013). This firmly confirmed the classification of IGR J17354−3255 as an SFXT. The Gaia mission provided accurate and reliable distance estimates of this counterpart (Gaia Collaboration 2016). Using Gaia EDR3 data (Gaia Collaboration 2021) and the distance estimates from Bailer-Jones et al. (2021), the distance of IGR J17354−3255 is estimated at  kpc. Swift/BAT (D’Aì et al. 2011) and INTEGRAL (Sguera et al. 2011) observations revealed an orbital period of 8.448 ± 0.002 days. The system likely has a low eccentricity (∼0.1 − 0.2). Studies with XMM-Newton (Bozzo et al. 2017) and INTEGRAL (Goossens et al. 2018) suggest that the flares of IGR J17354−3255 result from the accretion of dense clumps, rather than transitions in accretion mode. Since these flares are of intermediate luminosity and are associated with modest variations in the absorption column density, the system might be able to easily overcome physical mechanisms that inhibit accretion.
IGR J17354−3255 was also proposed as the best candidate counterpart to the γ-ray transient AGL J1734−3310 (Bulgarelli et al. 2009; Sguera et al. 2011; Sguera 2013). This source was discovered at energies > 100 MeV by the AGILE (Astrorivelatore Gamma ad Immagini LEggero, Tavani et al. 2009) mission on April 14, 2009, during a one-day flare. The proposed association between IGR J17354−3255 and AGL J1734−3310 is merely based on circumstantial evidence, such as positional association and flaring activity on similarly short timescales.
In this work, we conduct a comprehensive search for γ-ray emission from the IGR J17354−3255 region using the entire AGILE/GRID data archive, from 2007 to 2024, in the 100 MeV–10 GeV energy range. We improve the localisation of the HE transient, now renamed AGL J1736−3250, we discuss its HE emission, characterised by multiple γ-ray flares, and we analyse INTEGRAL and Swift data from the same region. In Sect. 2, we discuss the characterisation of the IGR J17354−3255 region. In Sect. 3 we describe the AGILE observations and report the data analysis methods and results in Sect. 4. In Sects. 5 and 6, we report the data analysis and results of INTEGRAL and Swift observations, respectively. In Sect. 7, we discuss our results, while our conclusions are reported in Sect. 8.
2. The IGR J17354–3255 region
IGR J17354−3255 is located in a region of the sky densely populated with other hard X-ray sources. However, it is the only hard X-ray object located within the error box of AGL J1736−3250, both in the original localisation2 (Bulgarelli et al. 2009) and in the updated coordinates inferred in Sect. 4.3 (see Fig. 1).
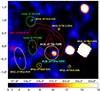 |
Fig. 1. INTEGRAL/IBIS mosaic significance map (18 − 60 keV) of the sky region around IGR J17354−3255 in Galactic coordinates. The refined positional uncertainty of AGL J1736−3250 is shown by the white circle (95% confidence level), with 2AGL sources in green ellipses and Fermi/LAT sources in yellow ellipses (95% confidence level). IGR J17354−3255, marked in cyan, is the only hard X-ray source detected (18σ, 10 Ms effective on-source exposure time) unambiguously located inside the error circle of AGL J1736−3250. The other two bright INTEGRAL/IBIS sources close to IGR J17354−3255 are the Low Mass X-ray binaries (LMXBs) GX 354−0 and 4U 1730−335. The red contours (from 50% to 99%) refer to the EGRET source 3EG J1734−3232. |
The region surrounding IGR J17354−3255 is also densely populated at MeV and GeV energies. Within 1.5 deg, there is one EGRET source (3EG J1734−3232, Hartman et al. 1999), two γ-ray sources from the second AGILE catalogue (Bulgarelli et al. 2019) and 11 γ-ray sources from the Fourth Fermi/LAT Catalogue (4FGL-DR4, Abdollahi et al. 2020; Ballet et al. 2023). We show in Fig. 1 the main γ-ray sources surrounding AGL J1736−3250, superimposed on the INTEGRAL/IBIS (Ubertini et al. 2003) significance map of the region obtained in Sect. 5. None of the 4FGL-DR4 nor the 2AGL sources near IGR J17354−3255 are spatially associated with it or with AGL J1736−3250.
The unidentified EGRET source 3EG J1734−3232 is positionally consistent with both AGL J1736−3250 and IGR J17354−3255. It is listed in the third EGRET catalogue as a ‘confused’ source, detected with significance of  and an average flux (E > 100 MeV) of (40.0 ± 6.7)⋅10−8 ph s−1 cm−2 (Hartman et al. 1999). Its ‘confused’ designation implies that the localisation may have significant uncertainties due to overlapping point spread functions (PSFs), suggesting that the source is likely a blend of several γ-ray sources. This hypothesis is strongly supported by AGILE and Fermi observations since, thanks to their excellent angular resolution, they have pinpointed the sources likely responsible for the emission of 3EG J1734−3232; namely, AGL J1736−3250 and the 4FGL J1732.5−3131 pulsar. This is further supported by the elongated shape of 3EG J1734−3232, which points towards the directions of the AGILE and Fermi sources. The hypothesis that the transient source AGL J1736−3250 contributes to the emission of the EGRET source is also supported by the measurements of the I index (Zhang et al. 2000) of 3EG J1734−3232, which suggests that it is a likely γ-ray variable source (Zhang et al. 2004).
3. AGILE observations
AGILE is a γ-ray and X-ray astrophysics mission by the Italian Space Agency (ASI) that operated from April 23, 2007, to February 14, 2024 (Tavani et al. 2008, 2009). Its instrument devoted to γ-ray imaging is the Gamma-Ray Imaging Detector (GRID), operating in the 30 MeV–50 GeV energy range. For details about AGILE and its operations, we refer to Barbiellini et al. (2001), Prest et al. (2003), Bulgarelli et al. (2010), Cattaneo et al. (2011), Feroci et al. (2007), Labanti et al. (2009), Perotti et al. (2006), Bulgarelli et al. (2013), Vercellone (2019), Pittori (2019). AGILE data is available at the AGILE Data Center3. The AGILE spacecraft operated in ‘pointing mode’ from the beginning of the mission to October 15, 2009, completing 101 observation blocks (OBs). The OBs4 usually consisted of predefined long exposures, drifting about 1 deg per day with respect to the initial boresight direction to obey solar panels constraints. In November 2009, the attitude control system was reconfigured, and scientific operations were performed in ‘spinning mode’ until the end of the mission. AGILE scanned ≈80% sky daily (exposure of ≈7 ⋅ 106 cm s) with an angular velocity of about 0.8 deg s−1, performing 200 passes per day on the same sky region.
A preliminary analysis of the AGILE data was performed using the public AGILE-LV3 web tool at SSDC5. The results presented and discussed in this work are based on a refined analysis of the entire AGILE consolidated archive, publicly available from SSDC. In Table 1, we report the AGILE observations of the IGR J17354−3255 region. The dataset includes observations in both pointing (September 1, 2007–October 15, 2009) and spinning (November 1, 2009–December 31, 2023) modes. During the pointing mode period, AGILE observed the IGR J17354−3255 region repeatedly for a total of 174 days. For the spinning mode period, we analysed only those sub-periods that maximise the exposure to the source (daily exposure > 3.456 ⋅ 106 cm2 s), resulting in the analysis of a fraction of the entire AGILE spinning period, amounting to 1819 days. Thus, we analysed a total of 1993 days.
AGILE observations of the IGR J17354−3255 region.
4. AGILE/GRID data analysis and results
We performed the analysis of AGILE/GRID γ-ray data using the FM3.119 on-ground background event filter, instrument response functions (IRFs) H0025 and the AGILE/GRID Science Tools (version BUILD25) publicly available at the ASI Science Data Center website. We applied a calibrated filter for γ-ray events to account for South Atlantic Anomaly event cuts and 80° Earth albedo filtering. The GRID event direction was reconstructed using a Kalman filter technique. To reduce particle background contamination, we selected only events flagged as confirmed γ-ray events (G class events). We generated the AGILE counts, exposure, and Galactic background maps over a 30 deg region centred on the position of IGR J17354−3255, with a bin size of 0.25° ×0.25° for E > 100 MeV. We employed the standard AGILE binned multi-source likelihood analysis method to assess the statistical significance of the sources in the target region and evaluate their period-averaged flux and evolution (Chen et al. 2013). The software iteratively optimised the position and spectrum of all the sources in the target region to search for both persistent and transient emission. The region’s emission model accounts for the Galactic diffuse γ-ray emission and the isotropic emission, that we modelled as fixed components with their average weekly level. These settings represent the standard hypothesis for AGILE data analysis. We used agilepy v1.6.36 as the front-end software. A complete description of the AGILE/GRID instrument, response characteristics, data analysis, and observation strategies is provided in Bulgarelli et al. (2019) and Bulgarelli et al. (2022).
The source model adopted for the analysis included a total of 22 sources. The first source represents AGL J1736−3250, the hypothesised counterpart of IGR J17354−3255, modelled as a point-like source with a power-law spectrum and a spectral index of 2.1 (the standard AGILE power-law model). The remaining 21 are 2AGL sources detected within a 15 deg radius of IGR J17354−3255, for which we fixed the position and spectra.
We performed four types of analysis: a search for transient γ-ray flares on fixed timescales (Sect. 4.1), the stacked analysis of all detected flaring episodes (Sect. 4.3), a phase-folded analysis assuming the orbital period of IGR J17354−3255 for AGL J1736−3250 (Sect. 4.4), and a search for periodic emission of the HE emission (Sect. 4.5).
4.1. Search for transient γ-ray emission
We evaluated the 0.1 − 10 GeV flux of the AGILE/GRID source at the IGR J17354−3255 position and its evolution by computing the light curve for the timescale of one day, which is consistent with the characteristic outburst episodes of SFXTs in the hard X-ray band. The spectral index was fixed at value 2.1. Our analysis identified 19 bins with  (corresponding to a 3σ statistical significance; see Appendix A) representing positionally consistent γ-ray flaring episodes, reported in Table 2. Eight of the flares were detected during ‘pointing mode’ observations, which covered 174 days, while 11 during ‘spinning mode’ observations, which spanned 1819 days. The lower detection rate in ‘spinning mode’ can be attributed to its reduced coverage of the target region, which is available for only a fraction of the total observing time, limiting the ability of AGILE to monitor the variability of a source on hour-long timescales. The flare with highest detection significance, labelled E05, was previously reported by Bulgarelli et al. (2009).
Flares detected by AGILE/GRID from AGL J1736−3250 in the 100 MeV−10 GeV energy range in the one-day light curve, and simultaneous INTEGRAL observations available.
To evaluate the statistical significance of the AGILE detections, we assessed the post-trial probability of multiple independent flares occurring from the same sky region within the analysis trials (i.e. the repeated flare occurrence). The post-trial probability of detecting 19 or more detections with significance ≥3σ out of 1993 trials under the null hypothesis is P = 7.448 ⋅ 10−10, corresponding to ∼6.04σ Gaussian standard deviations. Appendix A provide details on the pre-trial and post-trial significance evaluation, along with the TS distribution of the IGR J17354−3255 region with the likelihood test performed.
In Table 2, we also report the average orbital phase of each γ-ray flare, assuming a zero phase ephemeris at MJD 52698.205 and an orbital period of 8.4474 ± 0.0017 days, consistent with IGR J17354−3255 (D’Aì et al. 2011). In Fig. 4a we show the distribution of the detected γ-ray flares as a function of the binary system’s orbital phase. Approximately half of the γ-ray flares occurs near the apastron passages. Notably, 8 of the 19 flares were detected during the orbital phase interval [0.4375 − 0.500]. The probability of this clustering occurring by chance is 8.65 ⋅ 10−6, corresponding to ∼4.3σ Gaussian standard deviations. These results suggest that AGL J1736−3250 emits a significant fraction of its γ-ray flares near the apastron of IGR J17354−3255, while the other, smaller clustering of flares visible in Fig. 4a occurs around phase 0.75; the probability of detecting at least 7 flares within the phase interval [0.72 − 0.85] is 7.56 ⋅ 10−3 (corresponding to ∼2.5σ). This clustering, which includes the most significant flare (E05), may be a chance occurrence.
Since the variability of SFXT can occur on timescales of only a few hours, we investigated the intra-day behaviour of the flaring activity of AGL J1736−3250. For the 19 days with flaring days listed in Table 2, we computed light curves using predefined binning of 2 h, 4 h, and 6 h. For each daily flaring episode, we selected the bins with  and identified the one with the highest significance across the three light curves. We derived the flux and the photon excess associated with the short flare using a maximum likelihood analysis. The most significant intra-day flare for each episode is reported in Table 3. In most cases, we found that ≈25 − 50% of the photons detected in the day-long bursts were emitted within a shorter timescale. This dynamic behaviour, where emission is concentrated in fast, hour-long flares with a low duty cycle, is typical of SFXTs in hard X-ray band. Our analysis indicates that this behaviour is also present in the γ-ray band.
4.2. AGILE-Fermi comparison
No γ-ray source consistent with the position of IGR J17354−3255 is reported in the Fermi catalogue (Abdollahi et al. 2020) or in Fermi-LAT transient activity notices. This is not unprecedented, as other transient sources detected by AGILE have remained undetected by Fermi despite its larger average effective area; see for instance Alexander & McSwain (2015) and Munar-Adrover et al. (2016). These previous works have highlighted the conditions under which short flares may escape detection by Fermi-LAT. In practice, the detectability of transient emission depends not only on the effective area, but also on the source offset relative to the telescope pointing direction and the observing mode. Altogether, these properties determine the effective exposure time.
We computed the off-axis angles of AGL J1736−3250 with respect to the pointing directions of Fermi-LAT and AGILE-GRID during the 19 days, listed in Table 2, and during the most significant intra-day flares in Table 3. Fig. 2 compares the offset distributions for Fermi, AGILE pointing, and AGILE spinning observations. On average, Fermi/LAT observed the source with a duty cycle (fraction of time the source was observed with an offset < 50 deg) d50 ≈ 18% and a mean offset within that interval of 32.3 deg; similar values hold for the intervals of the most significant intra-day flares. For AGILE, the results differ significantly between pointing and spinning observing modes. Pointing observations achieve d50 = 100% with average offsets around 18.4 deg. In contrast, spinning mode observations yield d50 ≈ 25% and mean offsets of 30.6 deg, similar to Fermi. As an illustration, Fig. 3 shows the offset of AGL J1736−3250 during E17, when both satellites achieved comparable duty cycles and mean offsets.
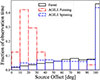 |
Fig. 2. Distribution of AGL J1736−3250 offset angles during the flaring days listed in Table 2, for AGILE pointing (dash–dotted red line), spinning (dashed blue line), and Fermi (solid black line) observations. The distribution is expressed as fraction of the observation time. |
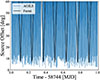 |
Fig. 3. Offset angle of AGL J1736−3250 for Fermi (black line) and AGILE (blue line) during flare E17, starting at MJD 58744. |
The main difference between AGILE and Fermi is thus the presence of AGILE’s pointed observations targeting the source after the initial 2009 flare detection, which provide continuous visibility required by our analysis. A crucial aspect of our methodology described in Section 4.1 is that none of the individual AGILE flaring episodes is highly significant on its own, but the evidence of a detection emerges only cumulatively when these episodes are coherently stacked under the repeated-flare hypothesis. This approach differs fundamentally from typical time-averaged or blind transient searches, where long integration periods, including many non-flaring intervals, can dilute short-duration signals below detectability. In this cumulative framework, the AGILE pointed observations are the main contributors to the final detection. When only pointed observations are included (8 flaring episodes over 174 days), the total significance reaches ∼6σ. Using only spinning-mode episodes (11 over 1819 days) yields a significantly lower cumulative significance of ∼3.8σ. Thus, it is AGILE’s pointed strategy that allowed us to capture a set of short, weak flares that remain statistically marginal unless combined coherently.
Although these considerations did not enable us to confirm or exclude the presence of a flare in Fermi data, they do demonstrate that suboptimal observing conditions could have prevented Fermi from detecting the AGL J1736−3250 flares. Additional differences might also arise from systematic effects in event classification, model selection, and background estimation, which are particularly critical for sources located on the Galactic plane such as AGL J1736−3250.
A preliminary analysis of the photometric Fermi light curves was conducted for the flare epochs and in the direction of AGL J1736−3250; however, it did not yield conclusive results. The light-curve fluxes do not show strong evidence of flaring activity, as expected due to contamination from at least three nearby sources (see Fig. 1), large PSF, and limited photon statistics. On the other hand, the photometric light-curve fluxes are consistent with the AGILE results. This supports the need for a dedicated and thorough Fermi analysis.
4.3. Stacked analysis of flaring episodes
We performed a stacked analysis of the flares in Table 2, yielding a significance of 11σ for the stacked dataset. The transient source is centred at Galactic coordinates (l, b) = (355.56, −0.25) deg, corresponding to (RA, Dec) = (17° 35′39″, −32° 49′53″). The position has a 95% error circle of 0.20 deg (statistical) ±0.07 deg (systematic). Additionally, the error ellipse has axes of (0.26, 0.14) deg ± 0.07 deg, with a rotation angle of 17.9 deg clockwise. Based on these findings, we designated the AGILE transient as AGL J1736−3250. The revised position of AGL J1736−3250 is closer to IGR J17354−3255 than the position previously determined.
Thanks to the increased photon statistics, the spectral index of AGL J1736−3250 was left free to vary, yielding a best-fit value of 2.10 ± 0.11. The average 0.1 − 10 GeV flux is (1.89 ± 0.27)⋅10−6 ph s−1 cm−2, corresponding to (3.52 ± 0.50)⋅10−9 erg s−1 cm−2. Assuming a source distance of 4.1 kpc, the average γ-ray flare luminosity is Lγ ≃ (7.1 ± 1.0)⋅1036 ph s−1.
In Fig. 1, we show the INTEGRAL/IBIS mosaic significance map (18 − 60 keV) of the sky region surrounding IGR J17354−3255, as obtained from the INTEGRAL/IBIS catalogue dataset (Bird et al. 2016). The refined positional uncertainty of AGL J1736−3250 is overlaid. IGR J17354−3255 is the only hard X-ray source detected by INTEGRAL within the AGILE error circle.
4.4. Phase-folded analysis
We searched for periodicity in the integrated data (1993 days with good exposure; see Sect. 3) folding the light curve of AGL J1736−3250 assuming the orbital period of IGR J17354−3255. In Fig. 4b we present the eight-bin γ-ray phase-folded light curve of AGL J1736−3250 in the 100 MeV − 10 GeV energy range. The light curve shows a higher than average flux during the [0.750 − 0.875] orbital phase. This phase coincides with a clustering of flares, which is clearly visible in Fig. 4a. The 0.1 − 10 Gev flux obtained stacking the eight phase bins is (3.08 ± 0.26)⋅10−7 ph s−1 cm−2.
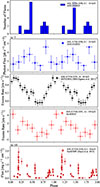 |
Fig. 4. Phase-folded light curves of AGL J1736−3250 and IGR J17354−3255. The zero phase ephemeris is MJD 52698.205 and the orbital period is (8.4474 ± 0.0017) d. Phase 0 is at periastron passage. From top to bottom: (a) Histogram of the number of flares detected by AGILE as reported in Table 2; (b) AGILE/GRID 0.1 − 10 GeV phase-folded light curve (1σ errors and upper limits), that results variable at 99% confidence level (see text); (c) INTEGRAL/IBIS 18 − 60 keV phase-folded light curve of IGR J17354−3255 (Sguera et al. 2011; d) Swift/BAT 14 − 195 keV phase-folded light curve of IGR J17354−3255; (e) Swift/XRT 0.3 − 10 keV phase-folded light curve of IGR J17354−3255 (Ducci et al. 2013). |
To evaluate variability, we computed the variability index VI (Bulgarelli et al. 2019) comparing the AGILE/GRID phase-folded light curve to a constant model. The VI index indicates AGL J1736−3250 is variable at 99% confidence level. However, this analysis does not distinguish whether the variability arises from periodic orbital modulation of the signal or non-periodic flaring activity. These observations suggest that the γ-ray variability of AGL J1736−3250 is not driven by orbital modulation, but it instead due to flaring activity.
4.5. Search for periodic γ-ray emission
We performed a timing analysis of AGL J1736−3250 data to assess whether the variability detected in Sect. 4.4 could be attributed to phase modulation with a period of 8.4474 days, corresponding to the orbital period of IGR J17354−3255. We created light curves using the aperture photometry technique on 1 h, 2 h, 4 h, and 1 d timescales, extracting photons from a circular region centred on X-ray coordinates of IGR J17354−3255, with radii of 2 deg and 3 deg in the 0.1 − 10 GeV energy range. The contribution of data points to the power spectrum was weighted by their relative exposures.
To search for periodicity, we applied the Lomb-Scargle (LS) periodogram, a widely used method for detecting sinusoidal periodic components in unevenly sampled time series (Lomb 1976; Scargle 1982; VanderPlas 2018). The LS algorithm, implemented via the AstroPy package (Astropy Collaboration 2013, 2018, 2022), estimates the Fourier power spectrum as a function of the oscillation period or frequency. No significant periodic components were detected in the data. These results suggest that the γ-ray variability of AGL J1736−3250 is not driven by the orbital modulation of IGR J17354−3255 and it is instead likely due to non-periodic flares.
5. INTEGRAL data analysis and results
The INTEGRAL mission has monitored the IGR J17354−3255 region since its discovery in 2006, accumulating ≳10 Ms of exposure time on the source, listed in several INTEGRAL IBIS/ISGRI catalogues (Bird et al. 2007, 2010, 2016; Krivonos et al. 2022). In Fig. 1 we show the INTEGRAL IBIS/ISGRI mosaic significance map (18 − 60 keV) of the sky region around IGR J17354−3255. In Fig. 4c we show the INTEGRAL IBIS/ISGRI folded light curve (18 − 60 keV) of IGR J17354−3255 published by Sguera et al. (2011), which reveals a smooth orbital modulation of the excess rate. The emission peaks during periastron passage and drops to excess rate values consistent with zero near apastron. The typical hard X-ray outbursts detected by INTEGRAL, with average X-ray luminosities of LX ∼ 1035 erg s−2, are unlikely to produce the observed smooth orbital emission profile over long-baseline observations, as shown, for example, in Fig. 4c. Instead, this behaviour is attributed to low-intensity hard X-ray emission, typically below the sensitivity of INTEGRAL, which becomes detectable only when long-exposure data are folded. The X-ray emission may thus represent a superposition of low-intensity activity with luminosities of ∼1033 − 34 erg s−2 (Sguera et al. 2011).
We analysed the INTEGRAL IBIS/ISGRI archive to search for hard X-ray flaring activity from IGR J17354−3255 in the 18 − 60 keV energy band simultaneous to the γ-ray flares detected by AGILE, using the latest ISDC offline scientific analysis software (version 11.2). As shown in Table 2, IGR J17354−3255 was within the INTEGRAL field of view (FoV) by chance during 5 of the 19 γ-ray flares detected by AGILE, although with low effective on-source exposure times (ranging from 3 − 12 ks. We did not find any significant detections (i.e. > 5σ) in the 18 − 60 keV energy band for any of the flares. In Table 2, we report the inferred 3σ upper limits on the hard X-ray luminosities, which are below values of the order of LX ≲ 2 ⋅ 1035 erg s−1. We computed IBIS/ISGRI light curves with 2 ks bins in the 18 − 60 keV range. We note that INTEGRAL observations did not cover the most significant intra-day flares detected by AGILE in Table 3, and no 2 ks-long flares were detected in the other bins of the IBIS/ISGRI 2 ks light curve.
6. Swift data analysis and results
Swift/BAT identified a counterpart to IGR J17354−3255 (Barthelmy et al. 2005), catalogued as Swift J1735.6−3255, in the 58-month hard X-ray survey (Baumgartner et al. 2010) and in the 54-month Palermo Swift/BAT hard X-ray catalogue (Cusumano et al. 2010).
For this study, we analysed the Swift/BAT data from the 70-Month Hard X-ray Survey (Baumgartner et al. 2011), covering the MJD range 53355−55469 (December 16, 2004 to September 30, 2010). We produced a folded light curve of the source in the 14 − 195 keV band, assuming the orbital period P = 8.4474 d = 729855.375 s of IGR J17354−3255 and its periastron passage at MJD 52698.205 as a zero phase ephemeris. We show the folded light curve in Fig. 4d, where we can see it exhibits emission modulation peaking at the periastron passage.
AGILE observations reported by Bulgarelli et al. (2009) triggered several Swift pointed observations of the IGR J17354−3255 region. These include observations on April 17, 2009 (Vercellone et al. 2009; Ducci et al. 2013). Furthermore, a Swift/XRT and Swift/UVOT monitoring campaign comprising 25 observations was performed in 11 days between July 18 and July 28, 2012 (Ducci et al. 2013). No AGILE flare detected in Table 2 was covered by these observations. In Fig. 4e we show the Swift/XRT folded light curve in the 0.3 − 10 keV energy range published by Ducci et al. (2013), which exhibits the same orbital modulation observed by Swift/BAT (D’Aì et al. 2011).
We also analysed the Swift/UVOT (Roming et al. 2005) data obtained simultaneously with the XRT observations using the UVOTIMSUM and UVOTSOURCE tasks in FTOOLS7 (NASA HEASARC 2014). The UVOTSOURCE task calculates the source magnitude through aperture photometry. Magnitudes are provided in the Vega photometric system (Poole et al. 2008) and are not corrected for Galactic extinction. We extracted the source counts from a circular region centred on IGR J17354−3255 with a radius of 5″. However, a nearby contaminating source within this radius precluded uncontaminated measurements, even when the extraction radius was reduced to 1″. We evaluated the background from source-free circular regions in the surroundings of the source. Due to contamination, we computed 3σ upper limits for the source magnitude in the U and UVM2 bands. During MJD 54536.2492 ± 0.2043, the U band magnitude upper limit was U > 20.81 mag (flux ϕU < 1.2 ⋅ 10−14 erg s−1 cm−2) and during MJD 54938.1900 ± 0.1420, the UVM2 band upper limit was UVM2 > 20.93 mag (flux ϕUVM2 < 8.7 ⋅ 10−15 erg s−1 cm−2). In Fig. 5, we show the Swift/UVOT images of IGR J17354−3255 in the U (left panel) and UVM2 (right panel) bands.
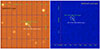 |
Fig. 5. Swift/UVOT images in band U (left panel) and UVM2 (right panel) of IGR J17354−3255. The green circles mark the 5″ radius for the Swift/UVOT pipeline extraction region; the white circles mark the position of the optical/infrared counterpart of the source, the 2MASS J17352760−3255544 star. The bright star inside the green circles is a contaminating source. |
7. Discussion
We analysed the entire (2007–2024) AGILE consolidated archive to search for γ-ray emission from the region of IGR J17354−3255. We report our results below.
7.1. Detection and multi-wavelength analysis of γ-ray flares from AGL J1736–3250
IGR J17354−3255 is classified as a SFXT exhibiting X-ray outbursts on timescales typically from a few hours to a few days; hence, we searched for γ-ray flares over similar durations. We identified 19 days (see Table 2) that were characterised by a statistical significance ≥3σ, yielding a 6.04σ detection under the hypothesis of repeated flare occurrence (see Appendix A). In most cases, ≈25 − 50% of photons detected in day-long flares were emitted over shorter timescales, as illustrated in Table 3. This indicates that AGL J1736−3250 is a γ-ray source with a low duty cycle, concentrating its emission in fast, hour-long flares. This dynamic behaviour mirrors that of IGR J17354−3255 in hard X-rays as detected by INTEGRAL.
The AGILE/GRID analysis (Sect. 4.1) detected eight of the 19 flares during AGILE’s ‘pointing mode’ observations, which feature a 70 − 88% duty cycle and an off-axis angle of 7 − 32 deg. This mode allowed near-continuous observations, interrupted only by spacecraft passages through the South Atlantic Anomaly, and likely explains the higher detection rate during this period. In contrast, AGILE’s ‘spinning mode’ has a 27 − 34% duty cycle and off-axis angle of 27 − 34 deg, providing less exposure to the target region. Detecting such flares requires optimal time coverage, achievable only through continuous observations. The observations conditions might be the reason why the AGL J1736−3250 was not detected by Fermi-LAT in any catalogue nor notice of transient observations.
A stacked analysis of the 19 flares confirmed the detection of the γ-ray source, named AGL J1736−3250, with a 11σ significance level. The only known hard X-ray source (> 20 KeV) located inside the error circle of AGL J1736−3250 is IGR J17354−3255 (see Fig. 1), which suggests a possible positive association between the two sources. The average γ-ray luminosity during flares is Lγ ≃ (7.1 ± 1.0)⋅1036 erg s−1 (0.1 − 10 GeV, assuming a source distance of 4.1 kpc), while typical γ-ray luminosity values are in the range (0.4 − 2)⋅1037 erg s−1.
IGR J17354−3255 was within the INTEGRAL FoV by chance during 5 of the 19 γ-ray flares with low effective on-source exposure times (in the range 3 − 12 ks). No significant emission was detected in the 18 − 60 keV energy band, with an inferred 3σ luminosity upper limits of ∼2 ⋅ 1035 erg s−1. Under the hypothesis that γ-ray flares and hard X-ray flares are produced by the same physical mechanism, this implies that Lγ ≫ LX by about one or two orders of magnitude. Notably, typical hard X-ray flares from IGR J17354−3255 detected by INTEGRAL are characterised by an average luminosity of ∼3 ⋅ 1035 erg s−1, with stronger hard X-ray flares (by a factor of ∼3) being very rare. In this context, the derived upper limits in Table 2 are consistent with the typical outburst hard X-ray luminosity. The lack of detections by INTEGRAL of hard X-ray flares simultaneous with the γ-ray flares detected by AGILE could be explained by the lack of observational coverage during the periods given in Table 3 and/or the significantly lower INTEGRAL effective exposure time with respect to good quality observing conditions. Alternative viable explanations include the possibility that hard X-ray and γ-ray flares are not produced by the same physical mechanism or that AGL J1736−3250 and IGR J17354−3255 are only closely aligned along the line of sight and are not physically associated.
7.2. Orbital modulation and variability of AGL J1736–3250 in relation to IGR J17354–3255
We investigated the potential connection between IGR J17354−3255 and AGL J1736−3250 by searching for an 8.4474 d periodicity in the AGILE data, which would provide firm evidence that the two sources are physically connected. The LS periodogram did not detect any sinusoidal periodic component, which could be potentially attributed to the signal having a non-sinusoidal periodicity, to an insufficient signal-to-noise ratio, or to the two sources not being physically connected.
To further explore the relationship, we computed the orbital phases of the 19 γ-ray flares, assuming AGL J1736−3250 is the γ-ray counterpart of IGR J17354−3255. Approximately half of the flares occur near the apastron passages of IGR J17354−3255. Notably, 8 of the 19 flares are concentrated within a narrow orbital phase range [0.4375 − 0.5000], corresponding to 1/16 of the orbit. The chance probability of this clustering is P = 8.65 ⋅ 10−6, equivalent to ∼4.3σ Gaussian standard deviations. If confirmed, this clustering near apastron would suggest a distinct origin for the γ-rays flares with respect to the hard X-ray flares, as the latter preferentially peak at periastron when the supergiant star is closest to the compact object and accretion is most efficient (e.g. Sguera et al. 2011; Ducci et al. 2013). This hypothesis aligns with the system’s estimated quasi-spherical orbit, with a low eccentricity of ∼0.1 − 0.2, which would suppress strong orbital modulation effects.
The folded X-ray light curves in Fig. 4 from INTEGRAL (18 − 60 keV), Swift/XRT (0.3 − 10 keV) and Swift/BAT (14 − 195 keV) exhibit smooth orbital modulation, driven by numerous low-threshold flares that are undetectable individually, but contribute cumulatively to the folded emission. In contrast, the AGILE light curve peaks coincide with the clustering of flares at phases ∼0.4 and ∼0.8, lacking the smooth modulation seen in X-rays. This result may suggest a different origin for the hard X-ray and γ-ray emissions.
We calculated the variability index VI for AGL J1736−3250, confirming variability at the 99% confidence level. The γ-ray variability is driven by random, non-periodic and bright flares, unlike the X-ray emission, which arises from regular, periodic accretion processes modulated by the orbital phase.
7.3. Evidence of distinct emission mechanisms in AGL J1736–3250 and IGR J17354–3255
Under the hypothesis that AGL J1736−3250 and IGR J17354−3255 represent the same source, our results (i.e. the INTEGRAL simultaneous upper limits during γ-ray flares, the clustering of γ-ray flares and the observed orbital modulations) suggest that the hard X-ray flares and the γ-ray flares are not produced by the same radiative process or at the same location. This conclusion is also supported by the lack of phase alignment in the phase-folded light curves of the two bands (see Fig. 4).
In Fig. 6 we present the spectral energy distribution of IGR J17354−3255, spanning from the X-ray to the HE γ-ray bands. It includes the Swift/XRT spectrum from 2009 observations triggered by Bulgarelli et al. (2009) and Vercellone et al. (2009), the IBIS/ISGRI average flare spectrum and the AGILE/GRID average γ-ray flaring emission from AGL J1736−3250. Additionally, it shows the out-of-outburst states for IBIS/ISGRI.
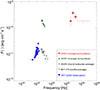 |
Fig. 6. Spectral energy distribution of IGR J17354−3255 covering eight orders of magnitude in energy. Blue squares represent the Swift/XRT spectrum (corrected for absorption) accumulated during the 2009 observation (2009-04-17 01:08:59 to 2009-04-17 07:57:56). Black circles represent the Swift/BAT 70-months average spectrum. Black triangles represent the INTEGRAL/ISGRI out-of-outburst average spectrum covering the period Feb. 2003 to Oct. 2008. Green triangles represent the average INTEGRAL/ISGRI spectrum during flares, covering the period Apr. 2003 to Mar. 2008. Red stars represent the average AGILE/GRID spectrum of AGL J1736−3250 during flares. |
The slope of the average IBIS/ISGRI out-of-outburst spectrum (open black triangles) and during flares (filled green triangles) are comparable, differing in flux intensity by a factor of ∼10. This is compatible with the ‘clumpy wind’ model, where variations in X-ray luminosity result from changes in the accretion rate of the compact object caused by the inhomogeneous and structured supergiant winds (Sguera et al. 2011; Bozzo et al. 2017; Goossens et al. 2018). During the out-of-outburst X-ray states, accretion continues but at lower rates, leading to reduced luminosities. Complications to the clumpy wind model were highlighted by Ducci et al. (2013), who identified a dip in the folded Swift/XRT light curve around phase ∼0.7. This dip, which cannot be attributed to lower wind accretion near apastron, might result from an eclipse or the onset of a ‘gated’ mechanism, which would enact a transition to a less efficient accretion process.
A comparison of IBIS/ISGRI and AGILE/GRID data, although not simultaneous, reveals a clear spectral break between X-rays and γ-rays, indicating distinct emission mechanisms if AGL J1736−3250 is associated with IGR J17354−3255. If confirmed, the source would exhibit γ-ray flare luminosities exceeding the X-ray flares luminosities, akin to the behaviour of gamma-ray binaries, that emit predominantly above ∼1 MeV.
We note that the nature of the compact object hosted in IGR J17354−3255 is still unknown. However, its broad band X-ray spectrum is typical of accreting neutron stars hosted in HMXBs. A possible explanation for the γ-ray emission from the source involves relativistic jets triggered by accretion of clumps from the supergiant’s wind. In fact, neutron stars might also be able to create relativistic jets. Sguera et al. (2009) discussed the possibility that MeV–GeV γ-ray flares in SFXTs could result from transient jets powered by magnetic towers formed during clump accretion. Magnetohydrodynamical simulations demonstrate that such structures can arise if accreting matter in the disk reaches ∼40 gravitational radii (Kato et al. 2004; Kato 2007). Simulations indicate that magnetic loops connecting the NS and disk are twisted due to differential rotation between the two. Twist injection from the disk expands the loops, creating a magnetic tower capable of collimating mass into bipolar jets. Magnetic reconnection within the loops may then intermittently inject hot bubbles from the disk into the tower. Particles within these bubbles could then be accelerated to HE, producing non-thermal emission. Notably, this mechanism imposes a constraint on the strength of the NS magnetic field, as a strong magnetic field can extend the magnetosphere and inhibit accretion. The formation of a magnetic tower and jets in NS require the magnetospheric radius, RM, and the gravitational radius, RG being RM ≲ 40RG, to allow matter to reach the magnetic loops at the base of the tower (Kato et al. 2004). For a NS with a mass of MNS = 1.4 M⊙, we have 40RG ≃ 1.7 ⋅ 107 cm. To satisfy the constraint on the magnetospheric radius, either very dense clumps (∼10−4 to 10−5 g cm−3) must accrete, which is inconsistent with the known properties of supergiant winds (e.g. Fornasini et al. 2023), or the NS must have a low magnetic field (BNS ≲ 1.2 ⋅ 108 G). Notably, NSs with such a low magnetic field, typical of old systems, have effectively been observed in some low-mass X-ray binaries (LMXBs), particularly Atoll- and Z-sources (Massi & Kaufman Bernadó 2008), known to launch radio jets. Conversely, known magnetic fields in HMXBs are typically BNS ∼ 1012 G, characteristic of young NSs. If a low-magnetic-field NS was hosted in an HMXB, it would indicate the presence of magnetic field decay processes efficient enough to reduce BNS by four orders of magnitude within 107 yr, the typical age of HMXBs (García et al. 2011; Li & Zhang 2011). Magneto-hydrodynamical simulations suggest that accretion from an inhomogeneous wind of a supergiant star can enhance magnetic field decay at the NS surface, achieving the required decay rates if the accretion rate satisfies Ṁ ≳ 10−10 M⊙ yr−1 (García et al. 2014). Assuming a spherical approximation for accretion in a wind-fed system, the corresponding X-ray luminosity is LX ≈ 0.1 Ṁc2, yielding LX ≳ 5.7 ⋅ 1035 erg s−1, consistent with observed values in SFXTs.
An important caveat of applying this scenario to IGR J17354−3255 concerns the energetic viability of the proposed γ-ray counterpart AGL J1736−3250. The γ-ray luminosity observed during the flares is significantly higher than the X-ray luminosity upper limits and, given the modest accretion rates inferred in this work, may even exceed the total accretion power available in the system, Lacc ∼ G MṀ/RNS, where M, Ṁ, and RNS are the neutron star mass, accretion rate, and radius, respectively. Furthermore, if the neutron star is indeed accreting, the magnetospheric radius Rm must be smaller than or comparable to the corotation radius Rco, which limits the possibility of extracting rotational energy from the neutron star magnetosphere. Therefore, although magnetospheric dissipation may in principle contribute to non-thermal emission, it is unlikely to account for the large energetic gap implied by the γ-ray flare luminosity.
These findings support the hypothesis that jet production in SFXTs, such as IGR J17354−3255, might be possible, but remains theoretically challenging. In this context, Sguera et al. (2009) proposed a model based on the accretion-jet framework to explain the γ-ray emission from the SFXT AX J1841.0−0536, spatially associated with the MeV transient 3EG J1837−0423 or the extended TeV source HESS J1841−055 (MAGIC Collaboration 2020). In this model, the high-energy emission is produced by the cooling of relativistic electrons accelerated within a collimated jet launched by the NS. Specifically, non-thermal X-ray and γ-ray emission could arise from synchrotron and inverse Compton processes, respectively (Sguera et al. 2009). Thus, the formation of transient magnetic towers and jets could explain the γ-ray emission from AGL J1736−3250 and remains consistent with the hypothesis that this source is the counterpart of IGR J17354−3255.
Another class of binary systems which exhibited transient gamma-ray emission is transitional millisecond pulsars (tMSPS, Papitto & de Martino 2022). In particular, systems such as PSR J1023+0038 exhibited a significant increase in gamma-ray luminosity when switching from a rotation-powered state to a disk-dominated state, an enhancement attributed to changes in magnetospheric configuration and the possible formation of an intra-binary shock (Stappers et al. 2014). Although SFXTs differ fundamentally from tMSPs in their donor type and accretion environment, it is worth noting that if a neutron star in a SFXT possesses an LMXB-like magnetic field, some analogous mechanisms (e.g. shocks or propeller-like episodes) could also contribute to high-energy emission. While speculative, these parallels highlight that gamma-ray production in binary systems might be more diverse than traditionally assumed.
8. Summary and conclusions
We analysed the AGILE consolidated archive to search for γ-ray emission in the 0.1 − 10 GeV range from the region of IGR J17354−3255, selecting 1993 days of observation with good exposure. Our analysis detected 19 flaring episodes on a 1 day timescale. The post-trial significance of repeated flare detection from the same sky region is 6.04σ, confirming the AGILE detection of a transient source, designated AGL J1736−3250.
Notably, eight of the flares occurred during ‘pointing mode’ observations, despite the shorter observation period compared to ‘spinning mode’. This suggests that continuous, uninterrupted observation is critical for detecting rapid transients such as AGL J1736−3250. Observations in spinning or survey modes are not suited to detect such transients, an important consideration for the design of future high-energy missions.
A periodic analysis of the AGILE data with LS periodogram on aperture photometry light curves revealed no sinusoidal periodicity in the γ-ray emission. However, the variability index of the light curve folded using the known ephemeris of IGR J17354−3255 confirmed AGL J1736−3250 as a variable source at a 99% confidence level. Unlike the smooth, folded X-ray light curves of INTEGRAL and Swift, which exhibit modulated orbital emission peaking at periastron, the AGILE/GRID γ-ray light curve peaks during flaring episodes. This suggests that the γ-ray variability is driven by stochastic, non-periodic, bright flares – rather than the regular stacked emission of numerous low-intensity flares as in the X-ray band (Sguera et al. 2011).
Approximately (25 − 50)% of the signal during most γ-ray flares was concentrated over a few hours, highlighting the high variability and low duty cycle of the source. The spatial correlation and the very similar transient behaviour on short timescales measured in the X-rays and γ-rays suggests a physical association between IGR J17354−3255 and AGL J1736−3250. As reported in our work, simultaneous INTEGRAL observations during five γ-ray flares did not detect any hard X-ray activity. This could be explained by the possibility that hard X-ray and γ-ray flares are produced by different physical mechanisms. However, we note that the flare hard X-ray luminosity upper limits are not very stringent due to the poor INTEGRAL exposure times, and their values are compatible with the typical flare average hard X-ray luminosity measured in IGR J17354−3255. This opens up the possibility that hard X-ray flares and γ-ray flares might still be produced by the same physical mechanism. However, we present additional evidence supporting the hypothesis of distinct emission mechanisms, i.e. an evident spectral break in the spectral energy distribution between X-rays and γ-rays of AGL J1736−3250 and IGR J17354−3255, and the lack of phase alignment in the orbital modulation observed in the two energy bands. In this context, we proposed a model based on the accretion-jet framework to explain the X-ray and the γ-ray emission from the SFXT IGR J17354−3255. The X-ray emission is likely driven by the accretion of clumps from the inhomogeneous supergiant wind onto the compact object. This accretion process may also power γ-ray emission through the formation of a transient magnetic tower and jet, a possible scenario in HMXBs hosting low-magnetised NSs according to simulations (Kato 2007; Sguera et al. 2009; García et al. 2014). However, the inferred γ-ray luminosity during the flares may be difficult to reconcile with the available accretion power and standard magnetospheric processes. In this context, the absence of dedicated radio observations represents a key limitation, as it prevents us from testing the presence of jets or non-thermal outflows that could contribute to the emission. This is especially relevant for HMXBs, as there are only a few systems hosting neutron stars that have shown radio emission and, thus, sub-GHz observations may be required to detect jet emission, if present (van den Eijnden et al. 2025). The lack of direct measurements of the neutron star magnetic field further limits our ability to assess the viability of this scenario. Similarly, a dedicated and thorough maximum likelihood analysis of Fermi-LAT data during the epochs of the AGILE detections is still missing and could provide an important independent test of the γ-ray activity. Therefore, while the empirical association between AGL J1736−3250 and IGR J17354−3255 is compelling, its physical interpretation remains an open issue that will require further multi-wavelength observations and more detailed theoretical investigations.
Our work provides evidence of a possible physical connection between IGR J17354−3255 and AGL J1736−3250, although this association is not yet firmly established. These findings reinforce the potential of SFXTs as sources of HE emission. Several studies have suggested that other HMXBs and SFXTs could also be candidate counterparts for unidentified transient HE and VHE sources on the Galactic plane (Sguera et al. 2009; Sguera 2009; Sguera et al. 2011; Orlandini et al. 2012; Munar-Adrover et al. 2016; Harvey et al. 2022). However, detecting such fast transients with current instruments is challenging due to the emission likely being composed of unpredictable and short flares. Furthermore, a firm confirmation of these sources require coordinated multi-wavelength studies to properly characterise the emission mechanisms and the physical properties of the systems.
Future advancements in γ-ray observatories facilities, such as upcoming COSI satellite mission observing at ∼1 MeV (Tomsick et al. 2023) and the Cherenkov Telescope Array Observatory (CTAO) in the VHE band, could provide significant improvements in sensitivity and survey speed. In particular, the CTAO will be particularly suited for fast transient astronomy thanks to its improved VHE sensitivity, more than one order of magnitude better than current VHE facilities (Carosi et al. 2021; Cherenkov Telescope Array Consortium 2019; Zanin et al. 2022; Abe et al. 2025), along with its capacity to swiftly react to external alerts on astrophysical transients by triggering ToO observations. The CTAO will be able to swiftly repoint its telescopes and perform real-time analyses using its Science Alert Generation system (Di Piano et al. 2021; Caroff et al. 2023; Bulgarelli et al. 2024), which is part of the Array Control and Data Acquisition of CTAO (Oya et al. 2024). These developments could enable the detection (or the non-detection) of SFXTs at HE and VHE energies, offering critical insights into extreme physical mechanisms and opening up an unexplored energy window. Such breakthroughs would have profound implications for understanding transient HE astrophysical phenomena and processes capable of emitting non-thermal radiation on very short timescales.
Acknowledgments
The AGILE Mission is funded by the Italian Space Agency (ASI) with scientific and programmatic participation by the Italian National Institute for Astrophysics (INAF) and the Italian National Institute for Nuclear Physics (INFN). The investigation is supported by the ASI-INAF agreement ASI-I/028/12/0 and subsequent addenda (up to ASI-I/028/12/7). We thank the ASI management for unfailing support during AGILE operations. We acknowledge the effort of ASI and industry personnel in operating the ASI ground station in Malindi (Kenya), and the data processing done at the ASI/SSDC in Rome: the success of AGILE scientific operations depends on the effectiveness of the data flow from Kenya to SSDC and the data analysis and software management. This research was funded by the “Programma di Ricerca Fondamentale INAF 2023” (PR). This work is based also on observation with INTEGRAL, an ESA Project with instruments and Science Data Center founded by ESA members states (especially France, Germany, Denmark, Italy, Spain and Switzerland) and the participation of Russia and the USA. Angela Bazzano acknowledges support via ASI/INAF agreement 2019-35-HH0. Facilities: AGILE(GRID), INTEGRAL(IBIS), Swift(BAT, XRT, and UVOT). Software: Astropy (Astropy Collaboration 2013, 2018, 2022), Agilepy (Bulgarelli et al. 2022). The AGILE data analysed in this work, along with the derived high-level maps and analysis notebooks have been made publicly available (https://github.com/AGILESCIENCE/AGILE_detection_AGLJ1736-3250.git) to support reproducibility (Bulgarelli & Panebianco 2026).
References
- Abdollahi, S., Acero, F., Ackermann, M., et al. 2020, ApJS, 247, 33 [Google Scholar]
- Abe, K., Abe, S., Abhir, J., et al. 2025, MNRAS, 540, 205 [Google Scholar]
- Alexander, M. J., & McSwain, M. V. 2015, MNRAS, 449, 1686 [NASA ADS] [CrossRef] [Google Scholar]
- Astropy Collaboration (Robitaille, T. P., et al.) 2013, A&A, 558, A33 [NASA ADS] [CrossRef] [EDP Sciences] [Google Scholar]
- Astropy Collaboration (Price-Whelan, A. M., et al.) 2018, AJ, 156, 123 [Google Scholar]
- Astropy Collaboration (Price-Whelan, A. M., et al.) 2022, ApJ, 935, 167 [NASA ADS] [CrossRef] [Google Scholar]
- Bailer-Jones, C. A. L., Rybizki, J., Fouesneau, M., et al. 2021, AJ, 161, 147 [NASA ADS] [CrossRef] [Google Scholar]
- Ballet, J., Bruel, P., Burnett, T. H., Lott, B. & The Fermi-LAT collaboration 2023, arXiv e-prints [arXiv:2307.12546] [Google Scholar]
- Barbiellini, G., Bordignon, G., Fedel, G., et al. 2001, AIP Conf. Ser., 587, 754 [Google Scholar]
- Barthelmy, S. D., Barbier, L. M., Cummings, J. R., et al. 2005, Space Sci. Rev., 120, 143 [Google Scholar]
- Baumgartner, W. H., Tueller, J., Markwardt, C., & Skinner, G. 2010, AAS/High Energy Astrophysics Division, 42, 675 [Google Scholar]
- Baumgartner, W. H., Tueller, J., Markwardt, C., et al. 2011, AAS/High Energy Astrophysics Division, 12, 7.29 [Google Scholar]
- Bird, A. J., Barlow, E. J., Bassani, L., et al. 2006, ApJ, 636, 765 [NASA ADS] [CrossRef] [Google Scholar]
- Bird, A. J., Malizia, A., Bazzano, A., et al. 2007, ApJS, 170, 175 [Google Scholar]
- Bird, A. J., Bazzano, A., Bassani, L., et al. 2010, ApJS, 186, 1 [NASA ADS] [CrossRef] [Google Scholar]
- Bird, A. J., Bazzano, A., Malizia, A., et al. 2016, ApJS, 223, 15 [Google Scholar]
- Bordas, P. 2024, PoS (Gamma2022), 417, 017 [Google Scholar]
- Bozzo, E., Pavan, L., Ferrigno, C., et al. 2012, A&A, 544, A118 [NASA ADS] [CrossRef] [EDP Sciences] [Google Scholar]
- Bozzo, E., Bernardini, F., Ferrigno, C., et al. 2017, A&A, 608, A128 [NASA ADS] [CrossRef] [EDP Sciences] [Google Scholar]
- Bulgarelli, A., & Panebianco, G. 2026, https://doi.org/10.5281/zenodo.18377895 [Google Scholar]
- Bulgarelli, A., Gianotti, F., Trifoglio, M., et al. 2009, ATel, 2017, 1 [NASA ADS] [Google Scholar]
- Bulgarelli, A., Argan, A., Barbiellini, G., et al. 2010, Nucl. Phys. A, 614, 213 [Google Scholar]
- Bulgarelli, A., Chen, A. W., Tavani, M., et al. 2012, A&A, 540, A79 [NASA ADS] [CrossRef] [EDP Sciences] [Google Scholar]
- Bulgarelli, A., Trifoglio, M., Gianotti, F., et al. 2013, ApJ, 781, 19 [Google Scholar]
- Bulgarelli, A., Fioretti, V., Parmiggiani, N., et al. 2019, A&A, 627, A13 [NASA ADS] [CrossRef] [EDP Sciences] [Google Scholar]
- Bulgarelli, A., Baroncelli, L., Addis, A., et al. 2022, ASP Conf. Ser., 532, 509 [Google Scholar]
- Bulgarelli, A., Caroff, S., Castaldini, L., et al. 2024, Proc. SPIE, 13101, 29 [Google Scholar]
- Caroff, S., Aubert, P., Garcia, E., et al. 2023, arXiv e-prints [arXiv:2309.11679] [Google Scholar]
- Carosi, A., López-Oramas, A., & Longo, F. 2021, 37th ICRC Conference [Google Scholar]
- Cattaneo, P., Argan, A., Boffelli, F., et al. 2011, Nucl. Phys. A, 630, 251 [Google Scholar]
- Chen, A. W., Argan, A., Bulgarelli, A., et al. 2013, A&A, 558, A37 [NASA ADS] [CrossRef] [EDP Sciences] [Google Scholar]
- Cherenkov Telescope Array Consortium (Acharya, B. S., et al.) 2019, Science with the Cherenkov Telescope Array (World Scientific) [Google Scholar]
- Chernyakova, M., Malyshev, D., Paizis, A., et al. 2019, A&A, 631, A177 [NASA ADS] [CrossRef] [EDP Sciences] [Google Scholar]
- Coleiro, A., Chaty, S., Zurita Heras, J. A., et al. 2013, A&A, 560, A108 [NASA ADS] [CrossRef] [EDP Sciences] [Google Scholar]
- Cusumano, G., La Parola, V., Segreto, A., et al. 2010, A&A, 524, A64 [NASA ADS] [CrossRef] [EDP Sciences] [Google Scholar]
- D’Aì, A., La Parola, V., Cusumano, G., et al. 2011, A&A, 529, A30 [NASA ADS] [CrossRef] [EDP Sciences] [Google Scholar]
- Di Piano, A., Bulgarelli, A., Fioretti, V., et al. 2021, 37th ICRC Conference [Google Scholar]
- Dubus, G. 2013, A&ARv, 21, 64 [Google Scholar]
- Ducci, L., Romano, P., Esposito, P., et al. 2013, A&A, 556, A72 [NASA ADS] [CrossRef] [EDP Sciences] [Google Scholar]
- Feroci, M., Costa, E., Soffitta, P., et al. 2007, Nucl. Phys. A, 581, 728 [Google Scholar]
- Fornasini, F., Antoniou, V., & Dubus, G. 2023, Handbook of X-ray and Gamma-ray Astrophysics (Springer Nature), 1 [Google Scholar]
- Gaia Collaboration (Prusti, T., et al.) 2016, A&A, 595, A1 [NASA ADS] [CrossRef] [EDP Sciences] [Google Scholar]
- Gaia Collaboration (Brown, A. G. A., et al.) 2021, A&A, 649, A1 [NASA ADS] [CrossRef] [EDP Sciences] [Google Scholar]
- García, F., Aguilera, D. N., & Romero, G. E. 2011, IAU Symp., 275, 309 [Google Scholar]
- García, F., Aguilera, D. N., & Romero, G. E. 2014, A&A, 565, A122 [NASA ADS] [CrossRef] [EDP Sciences] [Google Scholar]
- Goossens, M. E., Bird, A. J., Hill, A. B., et al. 2018, MNRAS, 485, 286 [Google Scholar]
- Hartman, R. C., Bertsch, D. L., Bloom, S. D., et al. 1999, ApJS, 123, 79 [CrossRef] [Google Scholar]
- Harvey, M., Rulten, C. B., & Chadwick, P. M. 2022, MNRAS, 512, 1141 [NASA ADS] [CrossRef] [Google Scholar]
- Kato, Y. 2007, Ap&SS, 307, 11 [Google Scholar]
- Kato, Y., Hayashi, M. R., & Matsumoto, R. 2004, ApJ, 600, 338 [Google Scholar]
- Kretschmar, P., Fürst, F., Sidoli, L., et al. 2019, New Astron. Rev., 86, 101546 [Google Scholar]
- Krivonos, R. A., Sazonov, S. Y., Kuznetsova, E., et al. 2022, MNRAS, 510, 4796 [NASA ADS] [CrossRef] [Google Scholar]
- Kuulkers, E., Shaw, S., Paizis, A., et al. 2006, ATel, 874, 1 [Google Scholar]
- Kuulkers, E., Shaw, S. E., Paizis, A., et al. 2007, A&A, 466, 595 [NASA ADS] [CrossRef] [EDP Sciences] [Google Scholar]
- Labanti, C., Marisaldi, M., Fuschino, F., et al. 2009, Nucl. Phys. A, 598, 470 [Google Scholar]
- Li, T. P., & Ma, Y. Q. 1983, ApJ, 272, 317 [CrossRef] [Google Scholar]
- Li, X. D., & Zhang, Z. 2011, MNRAS, 418, 556 [Google Scholar]
- Lomb, N. R. 1976, Ap&SS, 39, 447 [Google Scholar]
- MAGIC Collaboration (Acciari, V. A., et al.) 2020, MNRAS, 497, 3734 [Google Scholar]
- Martínez-Núñez, S., Kretschmar, P., Bozzo, E., et al. 2017, Space Sci. Rev., 212, 59 [Google Scholar]
- Massi, M., & Kaufman Bernadó, M. 2008, A&A, 477, 1 [NASA ADS] [CrossRef] [EDP Sciences] [Google Scholar]
- Munar-Adrover, P., Sabatini, S., Piano, G., et al. 2016, ApJ, 829, 101 [NASA ADS] [CrossRef] [Google Scholar]
- NASA HEASARC 2014, Astrophysics Source Code Library [record ascl:1408.004] [Google Scholar]
- Negueruela, I., Smith, D. M., Reig, P., et al. 2006, Proceedings of The X-ray Universe 2005 (ESA SP-604), 604, 165 [Google Scholar]
- Orlandini, M., Frontera, F., Masetti, N., et al. 2012, ApJ, 748, 86 [NASA ADS] [CrossRef] [Google Scholar]
- Oya, I., Aubert, P., Baroncelli, L., et al. 2024, Proc. SPIE, 13101, 131011D [Google Scholar]
- Papitto, A., & de Martino, D. 2022, Astrophys. Space Sci. Lib., 465, 157 [NASA ADS] [CrossRef] [Google Scholar]
- Paredes, J. M., & Bordas, P. 2019, Rend. Lincei. Sc. Fisiche e Naturali, 30, 107 [Google Scholar]
- Perotti, F., Fiorini, M., Incorvaia, S., et al. 2006, Nucl. Phys. A, 556, 228 [Google Scholar]
- Pittori, C. 2019, Rend. Lincei. Sc. Fisiche e Naturali, 30, 217 [Google Scholar]
- Poole, T. S., Breeveld, A. A., Page, M. J., et al. 2008, MNRAS, 383, 627 [Google Scholar]
- Prest, M., Barbiellini, G., Bordignon, G., et al. 2003, Nucl. Phys. A, 501, 280 [Google Scholar]
- Romano, P., Bozzo, E., Mangano, V., et al. 2015, A&A, 576, L4 [NASA ADS] [CrossRef] [EDP Sciences] [Google Scholar]
- Roming, P. W. A., Kennedy, T., Mason, K., et al. 2005, Space Sci. Rev., 120, 95 [NASA ADS] [CrossRef] [Google Scholar]
- Scargle, J. D. 1982, ApJ, 263, 835 [Google Scholar]
- Sguera, V. 2009, arXiv e-prints [arXiv:0902.0245] [Google Scholar]
- Sguera, V. 2013, Nucl. Phys. B Proc. Suppl., 239, 76 [Google Scholar]
- Sguera, V., Barlow, E. J., Bird, A. J., et al. 2005, A&A, 444, 221 [NASA ADS] [CrossRef] [EDP Sciences] [Google Scholar]
- Sguera, V., Bazzano, A., Bird, A. J., et al. 2006, ApJ, 646, 452 [NASA ADS] [CrossRef] [Google Scholar]
- Sguera, V., Romero, G. E., Bazzano, A., et al. 2009, ApJ, 697, 1194 [NASA ADS] [CrossRef] [Google Scholar]
- Sguera, V., Drave, S., Bird, A., et al. 2011, MNRAS, 417, 573 [NASA ADS] [CrossRef] [Google Scholar]
- Sidoli, L., Ponti, G., Sguera, V., & Esposito, P. 2023, A&A, 671, A150 [NASA ADS] [CrossRef] [EDP Sciences] [Google Scholar]
- Stappers, B. W., Archibald, A. M., Hessels, J. W. T., et al. 2014, ApJ, 790, 39 [Google Scholar]
- Tavani, M., Barbiellini, G., Argan, A., et al. 2008, Nucl. Phys. A, 588, 52 [Google Scholar]
- Tavani, M., Barbiellini, G., Argan, A., et al. 2009, A&A, 502, 995 [NASA ADS] [CrossRef] [EDP Sciences] [Google Scholar]
- Tomsick, J. A., Chaty, S., Rodriguez, J., et al. 2009, ApJ, 701, 811 [NASA ADS] [CrossRef] [Google Scholar]
- Tomsick, J. A., Boggs, S. E., Zoglauer, A., et al. 2023, arXiv e-prints [arXiv:2308.12362] [Google Scholar]
- Ubertini, P., Lebrun, F., Di Cocco, G., et al. 2003, A&A, 411, L131 [CrossRef] [EDP Sciences] [Google Scholar]
- van den Eijnden, J., Sidoli, L., Diaz Trigo, M., et al. 2025, MNRAS, 543, 862 [Google Scholar]
- VanderPlas, J. T. 2018, ApJS, 236, 16 [Google Scholar]
- Vercellone, S. 2019, Rend. Lincei. Sc. Fisiche e Naturali, 30, 131 [Google Scholar]
- Vercellone, S., D’Ammando, F., Striani, E., et al. 2009, ATel, 2019, 1 [NASA ADS] [Google Scholar]
- Winkler, C., Courvoisier, T. J. L., Di Cocco, G., et al. 2003, A&A, 411, L1 [NASA ADS] [CrossRef] [EDP Sciences] [Google Scholar]
- Zanin, R., Abdalla, H., Abe, H., et al. 2022, 37th International Cosmic Ray Conference, 5 [Google Scholar]
- Zhang, L., Zhang, Y. J., & Cheng, K. S. 2000, A&A, 357, 957 [Google Scholar]
- Zhang, S., Collmar, W., Hermsen, W., & Schönfelder, V. 2004, A&A, 421, 983 [NASA ADS] [CrossRef] [EDP Sciences] [Google Scholar]
2MASS J17352760−3255544, the companion donor star.
(RA, Dec) = (17° 34′44″, −33° 10′38″).
Appendix A: Evaluation of the p-value and post-trial statistical significance
We performed a simulation of the IGR J17354−3255 Galactic region, including the steady sources from the 2AGL catalogue, along with the Galactic diffuse and isotropic background emissions, in the source model. We assumed a one-day mean exposure level, using the average value of the exposure in ‘pointing’ and ‘spinning’ modes. The primary aim of the simulation was to evaluate the TS and the p-value distributions of the AGILE maximum likelihood estimator in the target region under the null hypothesis that no γ-ray source coincident with IGR J17354−3255 is present in the AGILE data. During the TS evaluation, all parameters of the 2AGL sources and the diffuse emission coefficients were kept fixed. We adopted a Galactic background coefficient of ggal = 0.6 and isotropic coefficient of giso = 8 (Bulgarelli et al. 2012).
We determined the p-value distribution, p(h), under the aforementioned null hypothesis of the likelihood test, which was the same adopted for the AGILE data analysis in Sect. 4. The p−value p(h) at a given TS threshold, h, is defined as
 (A.1)
(A.1)
where φ is the TS distribution, illustrated in Fig. A.1.
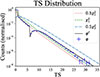 |
Fig. A.1. TS distribution of the IGR J17354−3255 sky region. Blue crosses represent the calculated distribution; the black line shows the best fit. The dotted red, dashed green, and dash-dotted cyan lines correspond to the 0.5χ12, χ12, and 0.5χ32 theoretical distributions, respectively. |
Bulgarelli et al. (2012) provided in Eq. (5) an analytical expression, φf, to approximate φ:
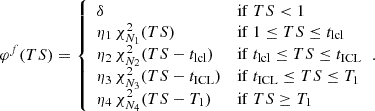 (A.2)
(A.2)
Equation (A.2) approximates the expected behaviour of the maximum likelihood analysis. This behaviour transitions from a source location algorithm with many free parameters near the threshold where the location contour is large (identified by tlcl) to an analysis resembling a fixed-position analysis at high TS values, where the location contour is small (identified by tICL and T1). We adopted tlcl = 6, tICL = 9, T1 = 14, typical values for the analysis of a Galactic region (Bulgarelli et al. 2012), and we report the best fit of the parameters in Table A.1.
Best-fit parameters of the analytical approximation φf of the TS distribution, defined in Eq. (A.2).
We show in Fig. A.2 the TS distribution under the null hypothesis when the flux and position of the AGL J1736−3250 source are allowed to vary, subject to the criterion that the source lies within the confidence contour level. Using this TS distribution, we selected the threshold to detect γ-ray flares in AGILE/GRID data. We fixed the threshold at  , corresponding to ≃3σ, while
  corresponds to ≃5σ.
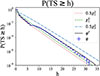 |
Fig. A.2. p-value distribution of the IGR J17354−3255 sky region. We employ the same colour coding of Fig. A.1. |
Typically, the post-trial significance of a TS evaluation is computed by treating each trial as a single independent occurrence (e.g. Li & Ma 1983), without considering the history of repeated occurrences. We accounted for the sky region’s history by computing the probability of ‘repeated flaring episodes’ from the same sky position. The chance probability of having k or more detections over N trials with TS ≥ h is given by
 (A.3)
(A.3)
where h is the minimum level of TS selected to include a temporal bin in the light curve, while p = p(h) is the corresponding p-value.
All Tables
Flares detected by AGILE/GRID from AGL J1736−3250 in the 100 MeV−10 GeV energy range in the one-day light curve, and simultaneous INTEGRAL observations available.
Best-fit parameters of the analytical approximation φf of the TS distribution, defined in Eq. (A.2).
All Figures
|
Fig. 1. INTEGRAL/IBIS mosaic significance map (18 − 60 keV) of the sky region around IGR J17354−3255 in Galactic coordinates. The refined positional uncertainty of AGL J1736−3250 is shown by the white circle (95% confidence level), with 2AGL sources in green ellipses and Fermi/LAT sources in yellow ellipses (95% confidence level). IGR J17354−3255, marked in cyan, is the only hard X-ray source detected (18σ, 10 Ms effective on-source exposure time) unambiguously located inside the error circle of AGL J1736−3250. The other two bright INTEGRAL/IBIS sources close to IGR J17354−3255 are the Low Mass X-ray binaries (LMXBs) GX 354−0 and 4U 1730−335. The red contours (from 50% to 99%) refer to the EGRET source 3EG J1734−3232. |
| In the text | |
|
Fig. 2. Distribution of AGL J1736−3250 offset angles during the flaring days listed in Table 2, for AGILE pointing (dash–dotted red line), spinning (dashed blue line), and Fermi (solid black line) observations. The distribution is expressed as fraction of the observation time. |
| In the text | |
|
Fig. 3. Offset angle of AGL J1736−3250 for Fermi (black line) and AGILE (blue line) during flare E17, starting at MJD 58744. |
| In the text | |
|
Fig. 4. Phase-folded light curves of AGL J1736−3250 and IGR J17354−3255. The zero phase ephemeris is MJD 52698.205 and the orbital period is (8.4474 ± 0.0017) d. Phase 0 is at periastron passage. From top to bottom: (a) Histogram of the number of flares detected by AGILE as reported in Table 2; (b) AGILE/GRID 0.1 − 10 GeV phase-folded light curve (1σ errors and upper limits), that results variable at 99% confidence level (see text); (c) INTEGRAL/IBIS 18 − 60 keV phase-folded light curve of IGR J17354−3255 (Sguera et al. 2011; d) Swift/BAT 14 − 195 keV phase-folded light curve of IGR J17354−3255; (e) Swift/XRT 0.3 − 10 keV phase-folded light curve of IGR J17354−3255 (Ducci et al. 2013). |
| In the text | |
|
Fig. 5. Swift/UVOT images in band U (left panel) and UVM2 (right panel) of IGR J17354−3255. The green circles mark the 5″ radius for the Swift/UVOT pipeline extraction region; the white circles mark the position of the optical/infrared counterpart of the source, the 2MASS J17352760−3255544 star. The bright star inside the green circles is a contaminating source. |
| In the text | |
|
Fig. 6. Spectral energy distribution of IGR J17354−3255 covering eight orders of magnitude in energy. Blue squares represent the Swift/XRT spectrum (corrected for absorption) accumulated during the 2009 observation (2009-04-17 01:08:59 to 2009-04-17 07:57:56). Black circles represent the Swift/BAT 70-months average spectrum. Black triangles represent the INTEGRAL/ISGRI out-of-outburst average spectrum covering the period Feb. 2003 to Oct. 2008. Green triangles represent the average INTEGRAL/ISGRI spectrum during flares, covering the period Apr. 2003 to Mar. 2008. Red stars represent the average AGILE/GRID spectrum of AGL J1736−3250 during flares. |
| In the text | |
|
Fig. A.1. TS distribution of the IGR J17354−3255 sky region. Blue crosses represent the calculated distribution; the black line shows the best fit. The dotted red, dashed green, and dash-dotted cyan lines correspond to the 0.5χ12, χ12, and 0.5χ32 theoretical distributions, respectively. |
| In the text | |
|
Fig. A.2. p-value distribution of the IGR J17354−3255 sky region. We employ the same colour coding of Fig. A.1. |
| In the text | |
Current usage metrics show cumulative count of Article Views (full-text article views including HTML views, PDF and ePub downloads, according to the available data) and Abstracts Views on Vision4Press platform.
Data correspond to usage on the plateform after 2015. The current usage metrics is available 48-96 hours after online publication and is updated daily on week days.
Initial download of the metrics may take a while.