Open Access
Fig. F.1.
Download original image
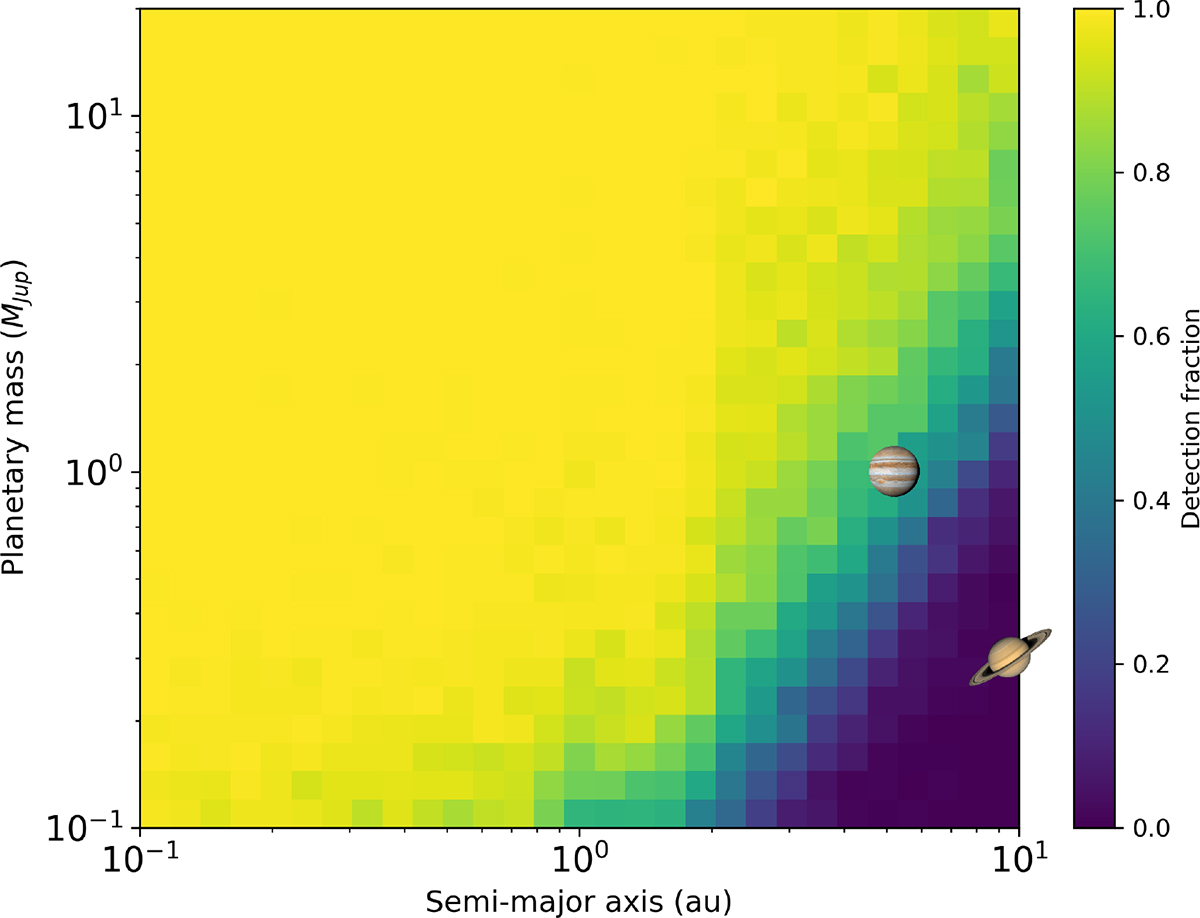
Detection completeness map for TOI-1710 in the mass versus semi-major axis plane, based on the RV injection-recovery analysis. The colour scale represents the fraction of simulated planetary companions recovered in each grid cell. For reference, the locations of Jupiter and Saturn are shown as icons.
Current usage metrics show cumulative count of Article Views (full-text article views including HTML views, PDF and ePub downloads, according to the available data) and Abstracts Views on Vision4Press platform.
Data correspond to usage on the plateform after 2015. The current usage metrics is available 48-96 hours after online publication and is updated daily on week days.
Initial download of the metrics may take a while.