Open Access
Fig. A.1.
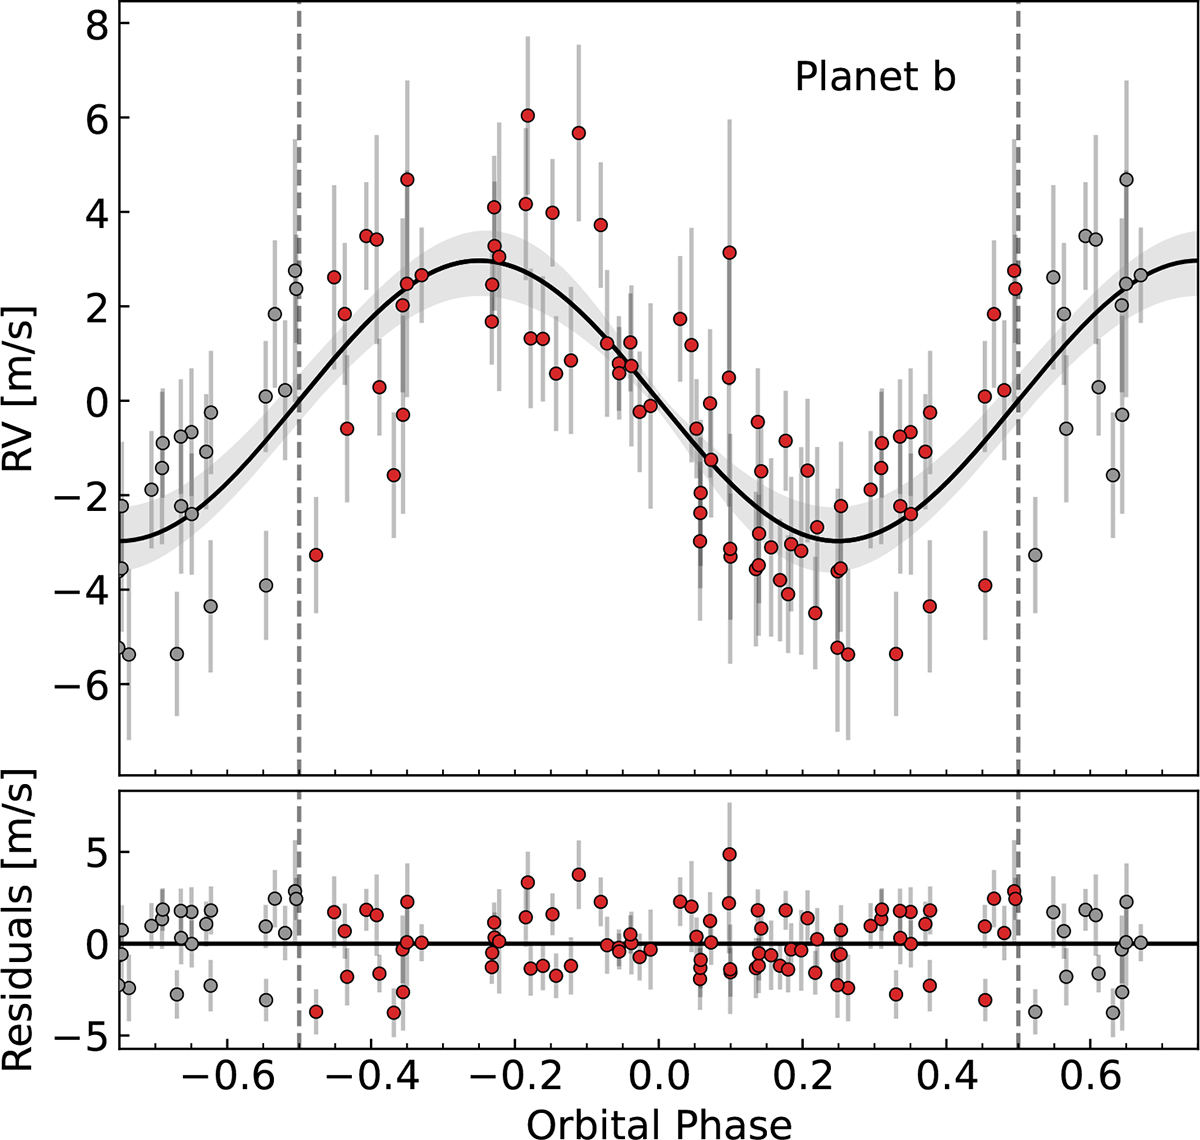
Download original image
Phase-folded RV curve of TOI-1710 b. The grey-shaded area shows the ±1σ uncertainties of the model, while the residuals are shown in the bottom panel. The fitted stellar activity and polynomial function are subtracted from the data points.
Current usage metrics show cumulative count of Article Views (full-text article views including HTML views, PDF and ePub downloads, according to the available data) and Abstracts Views on Vision4Press platform.
Data correspond to usage on the plateform after 2015. The current usage metrics is available 48-96 hours after online publication and is updated daily on week days.
Initial download of the metrics may take a while.