Fig. 7
Download original image
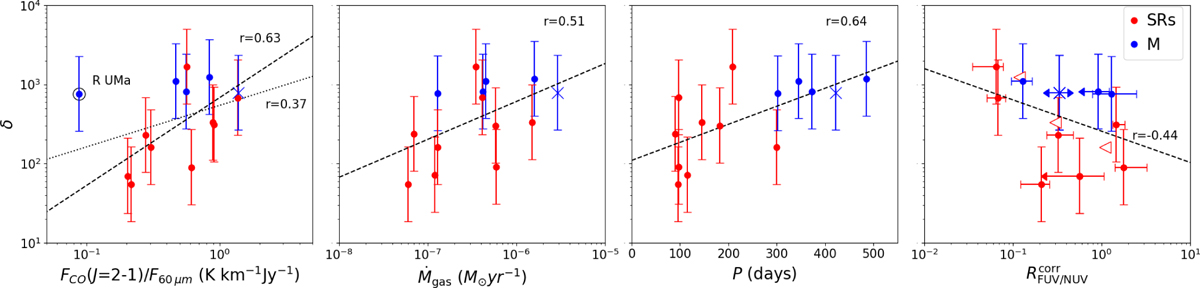
Comparison between the gas-to-dust ratio and different parameters (from left to right : ratio of CO J=2-1 velocity-integrated line flux to the IRAS 60 μm flux, Ṁgas, P, and ![]() ). The colour and shape of the markers represent the stellar variability and chemistry type as in Fig. 4. The dashed lines represent linear fits to the points, and the dotted line in the first panel is the best fit excluding R UMa. Error bars of
). The colour and shape of the markers represent the stellar variability and chemistry type as in Fig. 4. The dashed lines represent linear fits to the points, and the dotted line in the first panel is the best fit excluding R UMa. Error bars of ![]() are estimated as in Fig. 5. Empty arrows are upper limits for non-detections in the FUV.
are estimated as in Fig. 5. Empty arrows are upper limits for non-detections in the FUV.
Current usage metrics show cumulative count of Article Views (full-text article views including HTML views, PDF and ePub downloads, according to the available data) and Abstracts Views on Vision4Press platform.
Data correspond to usage on the plateform after 2015. The current usage metrics is available 48-96 hours after online publication and is updated daily on week days.
Initial download of the metrics may take a while.