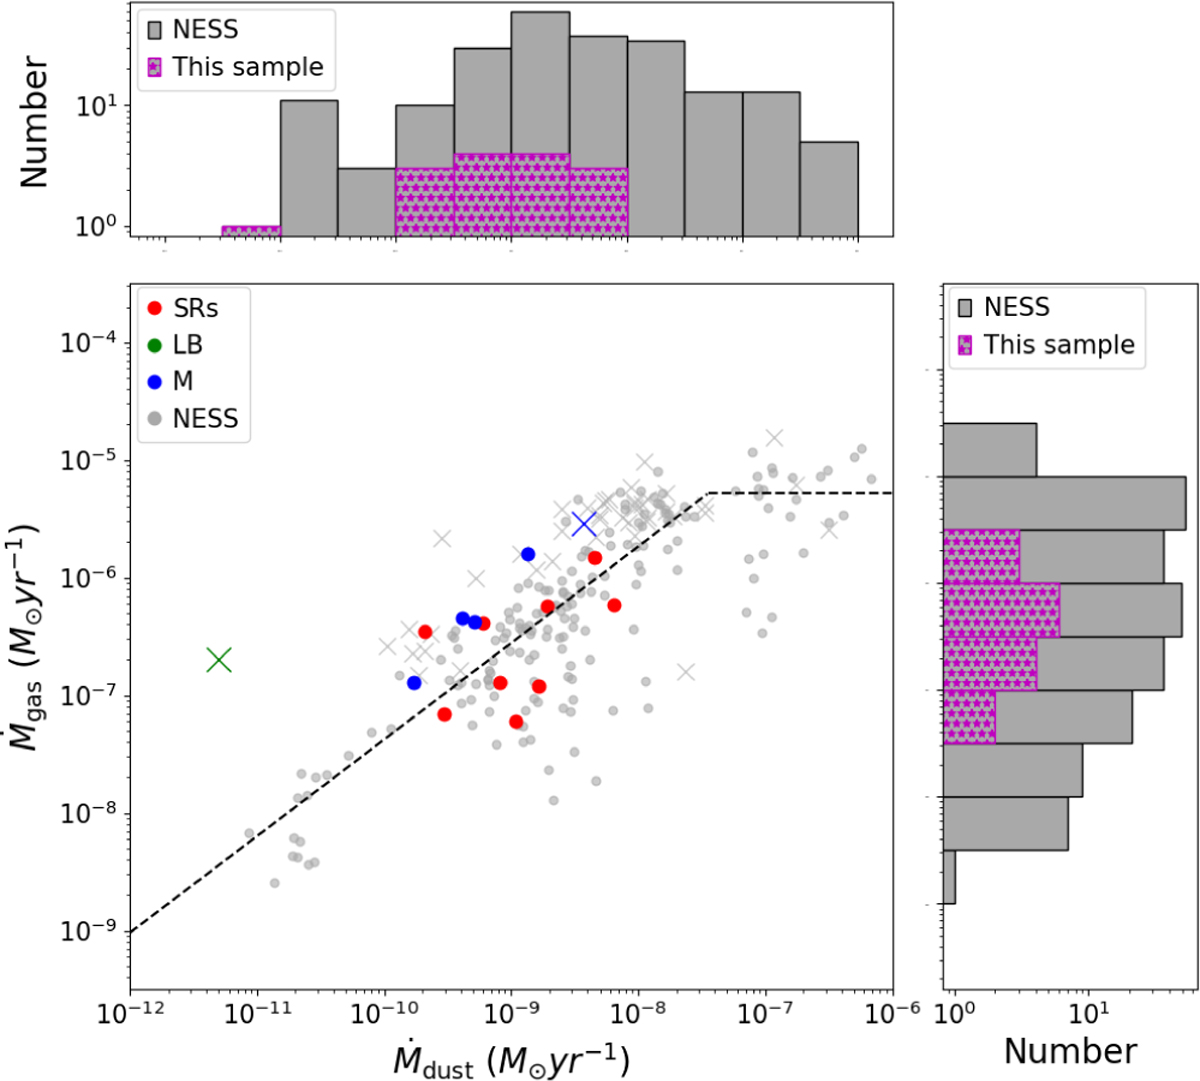
Fig. 6
Download original image
Comparison between the gas and dust mass-loss rates for our sample of uvAGBs. The colour and shape of the markers represent the stellar variability and chemistry type as in Fig. 4. Grey markers represent sources from the NESS sample. The dashed line represents the relationship presented in Wallström et al. (2025). The histograms at the top and to the right of the figure indicate the distribution of Ṁdust and Ṁgas respectively.
Current usage metrics show cumulative count of Article Views (full-text article views including HTML views, PDF and ePub downloads, according to the available data) and Abstracts Views on Vision4Press platform.
Data correspond to usage on the plateform after 2015. The current usage metrics is available 48-96 hours after online publication and is updated daily on week days.
Initial download of the metrics may take a while.