Fig. 5
Download original image
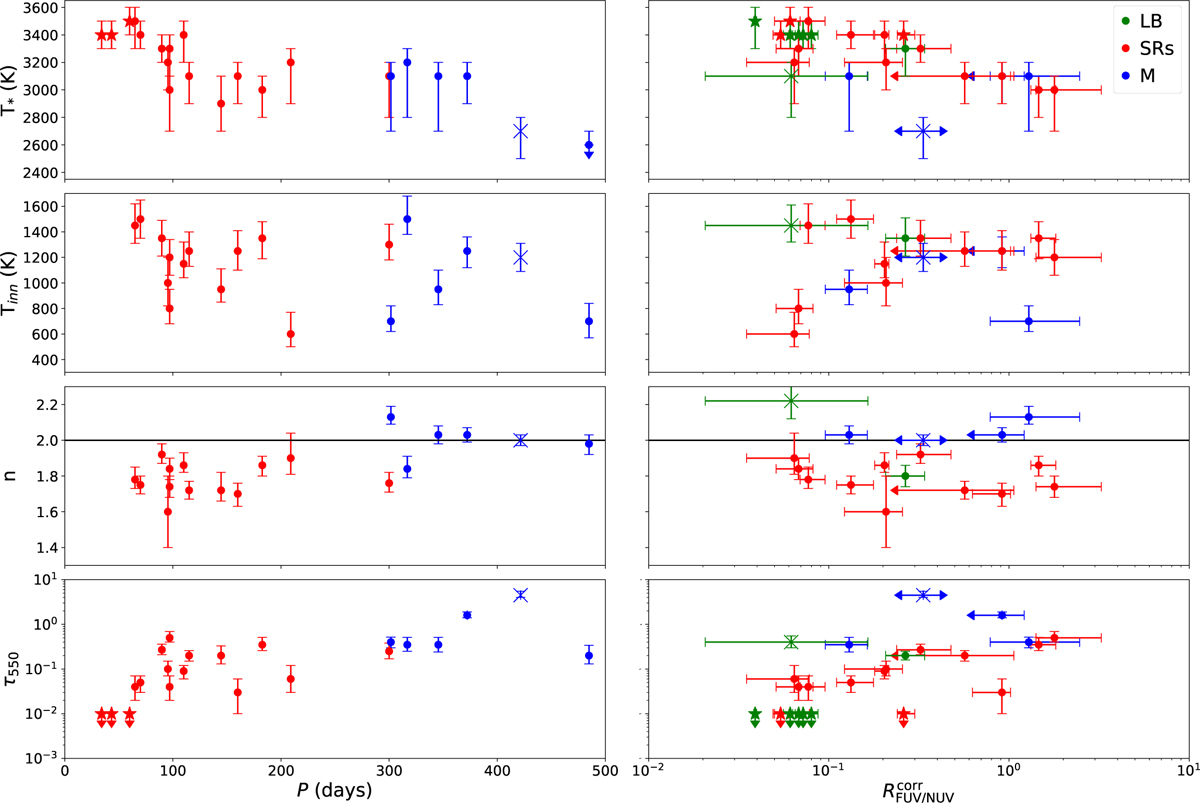
Comparison of the best-fit solution SED modelling parameters (from top to bottom : T*, Tinn, n and τ550) with P (left) and ![]() (right). The colour and shape of the markers represent the stellar variability and chemistry type as in Fig. 4. The horizontal line in the third row represents n=2. Error bars of
(right). The colour and shape of the markers represent the stellar variability and chemistry type as in Fig. 4. The horizontal line in the third row represents n=2. Error bars of ![]() include the multi-epoch variability of sources detected in both GALEX bands, arrows indicate that one observation was an upper limit.
include the multi-epoch variability of sources detected in both GALEX bands, arrows indicate that one observation was an upper limit.
Current usage metrics show cumulative count of Article Views (full-text article views including HTML views, PDF and ePub downloads, according to the available data) and Abstracts Views on Vision4Press platform.
Data correspond to usage on the plateform after 2015. The current usage metrics is available 48-96 hours after online publication and is updated daily on week days.
Initial download of the metrics may take a while.