Fig. F.2
Download original image
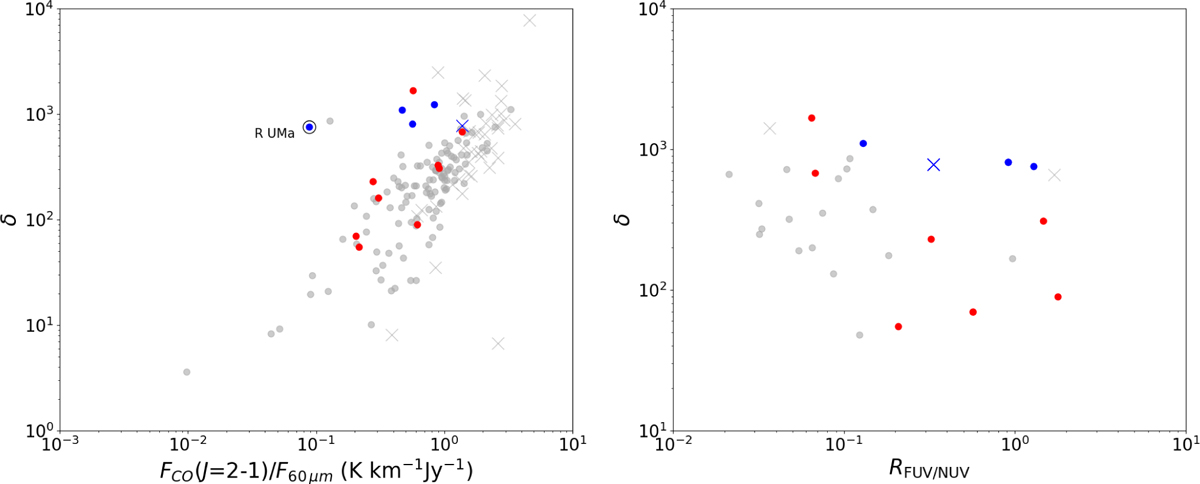
Comparison of the gas-to-dust ratio with the ratio between CO( J=2-1) and IRAS 60 μm and RFUV/NUV (left and right respectively). The colour and shape of the markers represent the stellar variability and chemistry type as in Fig. 4. Empty triangles are upper limits for the CO( J=2-1) intensities. Grey markers represent NESS sources. The values of RFUV/NUV shown in this figure were not corrected from dust attenuation. It can be appreciated a correlation and an anticorrelation in the figures on the left and right respectively.
Current usage metrics show cumulative count of Article Views (full-text article views including HTML views, PDF and ePub downloads, according to the available data) and Abstracts Views on Vision4Press platform.
Data correspond to usage on the plateform after 2015. The current usage metrics is available 48-96 hours after online publication and is updated daily on week days.
Initial download of the metrics may take a while.